Analysing sales data
How to use AI to analyse your sales data and uncover key insights efficiently.
2024-11-13
By analysing your sales data, you can gain valuable insights about your business performance, identify trends, and make data-driven decisions to optimise your sales strategy.
In this tutorial, we'll show you how to leverage ChatGPT to analyse your sales data and uncover key insights efficiently.
Steps:
- Upload your sales data and ask Claude to identify the date range of orders received
- Request a graph of monthly sales over time
- Ask for graphs showing sales volume and revenue by product line
- Exclude incomplete months from the graphs for more accurate analysis
- Determine the top-performing products based on the data
- Segment customers by average spend
- Compare sales data to identify products with the worst performance in specific months
Upload your sales data
Start by uploading your sales data file (e.g., CSV) to ChatGPT. Then, ask ChatGPT to analyse the data and provide the date range of the orders you've received. This will give you an overview of the time period your data covers.
Suggested prompt:
Here's my sales data. Can you tell me the date range of orders we've received?
.webp)
Graph of monthly sales over time
To visualise how your sales have been trending, ask ChatGPT to generate a graph displaying your monthly sales over time. This will help you identify any seasonal patterns or overall growth trends in your business.
Can you show me a graph of monthly sales over time?
.webp)
Sales volume and revenue by product line
To examine your product performance more closely, request graphs from Claude that showcase sales volume and revenue broken down by product line. This will reveal which product lines are driving the most sales and revenue for your business.
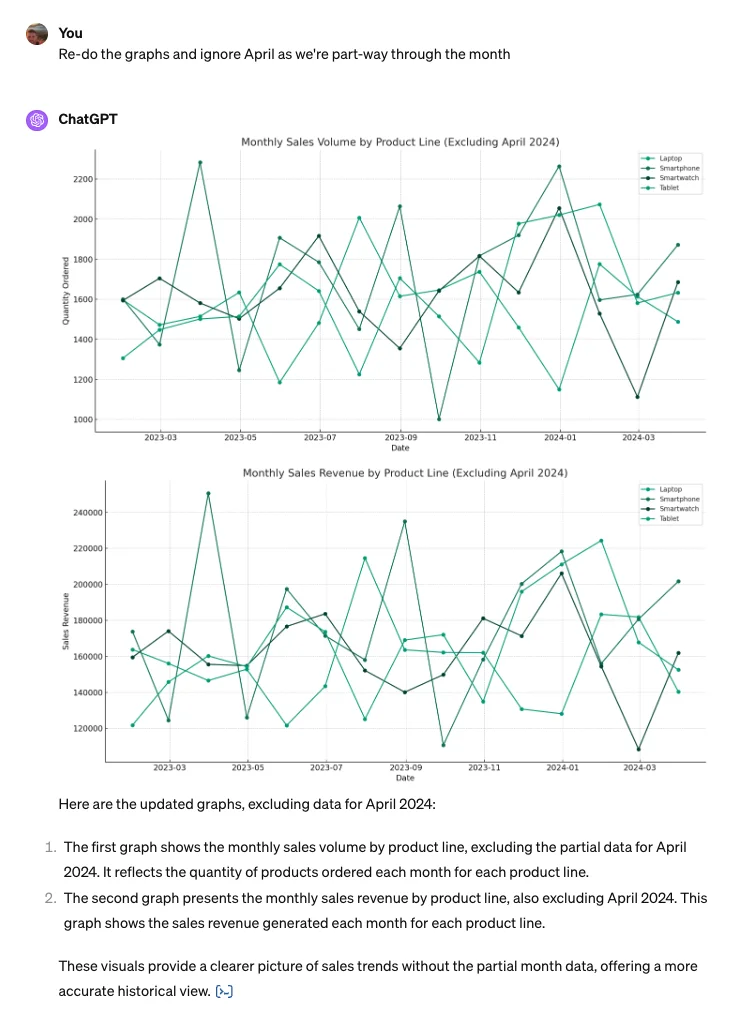
Can you show me a similar graph that includes sales volume by product line and another that shows sales revenue by product line
.webp)
If your data includes partial months (e.g., only 9 days of data for April), ask ChatGPT to re-generate the graphs while excluding those incomplete months. This will provide a more accurate representation of your sales trends.
Determine the top-performing products
To identify your star products, ask ChatGPT to analyse the data and list out your top-performing products based on sales volume or revenue. This insight will help you focus your efforts on promoting and optimising these high-performing products.
What are the top performing products?
.webp)
Segment customers by average spend
Ask ChatGPT to segment your customer base based on their average spending to gain a better understanding. This segmentation can help you tailor your marketing and sales strategies to different customer groups.
Can you segment customers by average spend
.webp)
Compare sales data
Finally, ask ChatGPT to compare your sales data across products and months to pinpoint which products perform the worst in certain months. This information can help you make decisions about inventory management, promotional campaigns, or product improvements.
Comparing sales data, which products have the worst performance in which months?
.webp)