Analyze employee turnover and develop retention strategies
Identify factors contributing to employee turnover and create targeted retention strategies with Claude
2024-12-12
High employee turnover bleeds companies dry. It's a resource drain, morale killer, and productivity assassin. This tutorial will show you how to use Claude, an AI assistant, to dissect your turnover data and craft retention strategies that actually work.
In this tutorial, you'll learn how to:
- Set up a Claude project
- Dig into turnover patterns
- Crunch the numbers on key turnover metrics
- Generate retention strategies
- Produce an action plan
Let’s get to it.
Step 1: Set up a Claude project
We’ll use Claude's projects in this tutorial to help us analyze the turnover data. The benefit of using a project is that you can easily add new data as it becomes available. It helps manage different chats about the data without re-uploading everything each time. Since we're dealing with multiple files for employee turnover, a project is the way to go.
Here's how to set one up:
Go to claude.ai and create an account if you haven't.

After signing up, go to the Projects section and click "Create Project".
Name it "Employee Turnover Analysis" and hit "Create Project".
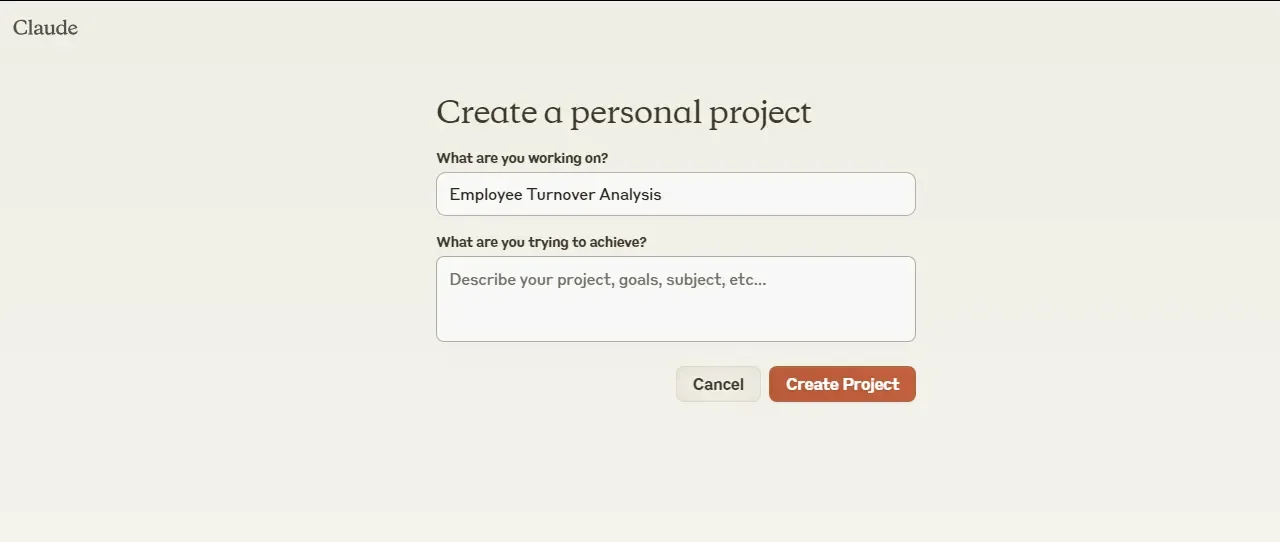
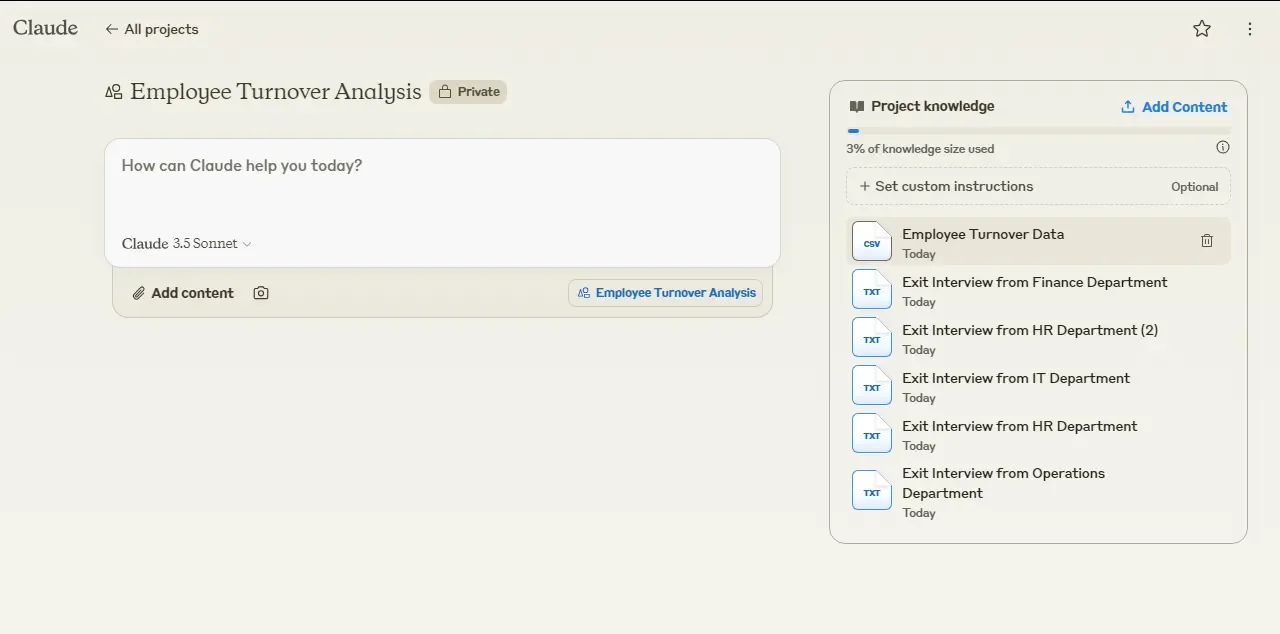
Click "Add Content" to upload your turnover data, exit interview summaries, and any other relevant info. You can upload files or paste text directly.
Digging into the root causes of high turnover helps you see beyond symptoms to underlying issues. Maybe high turnover in sales isn't just about commission structure - it could be a sign of deeper problems with your product or market fit.
Now let's put Claude to work:
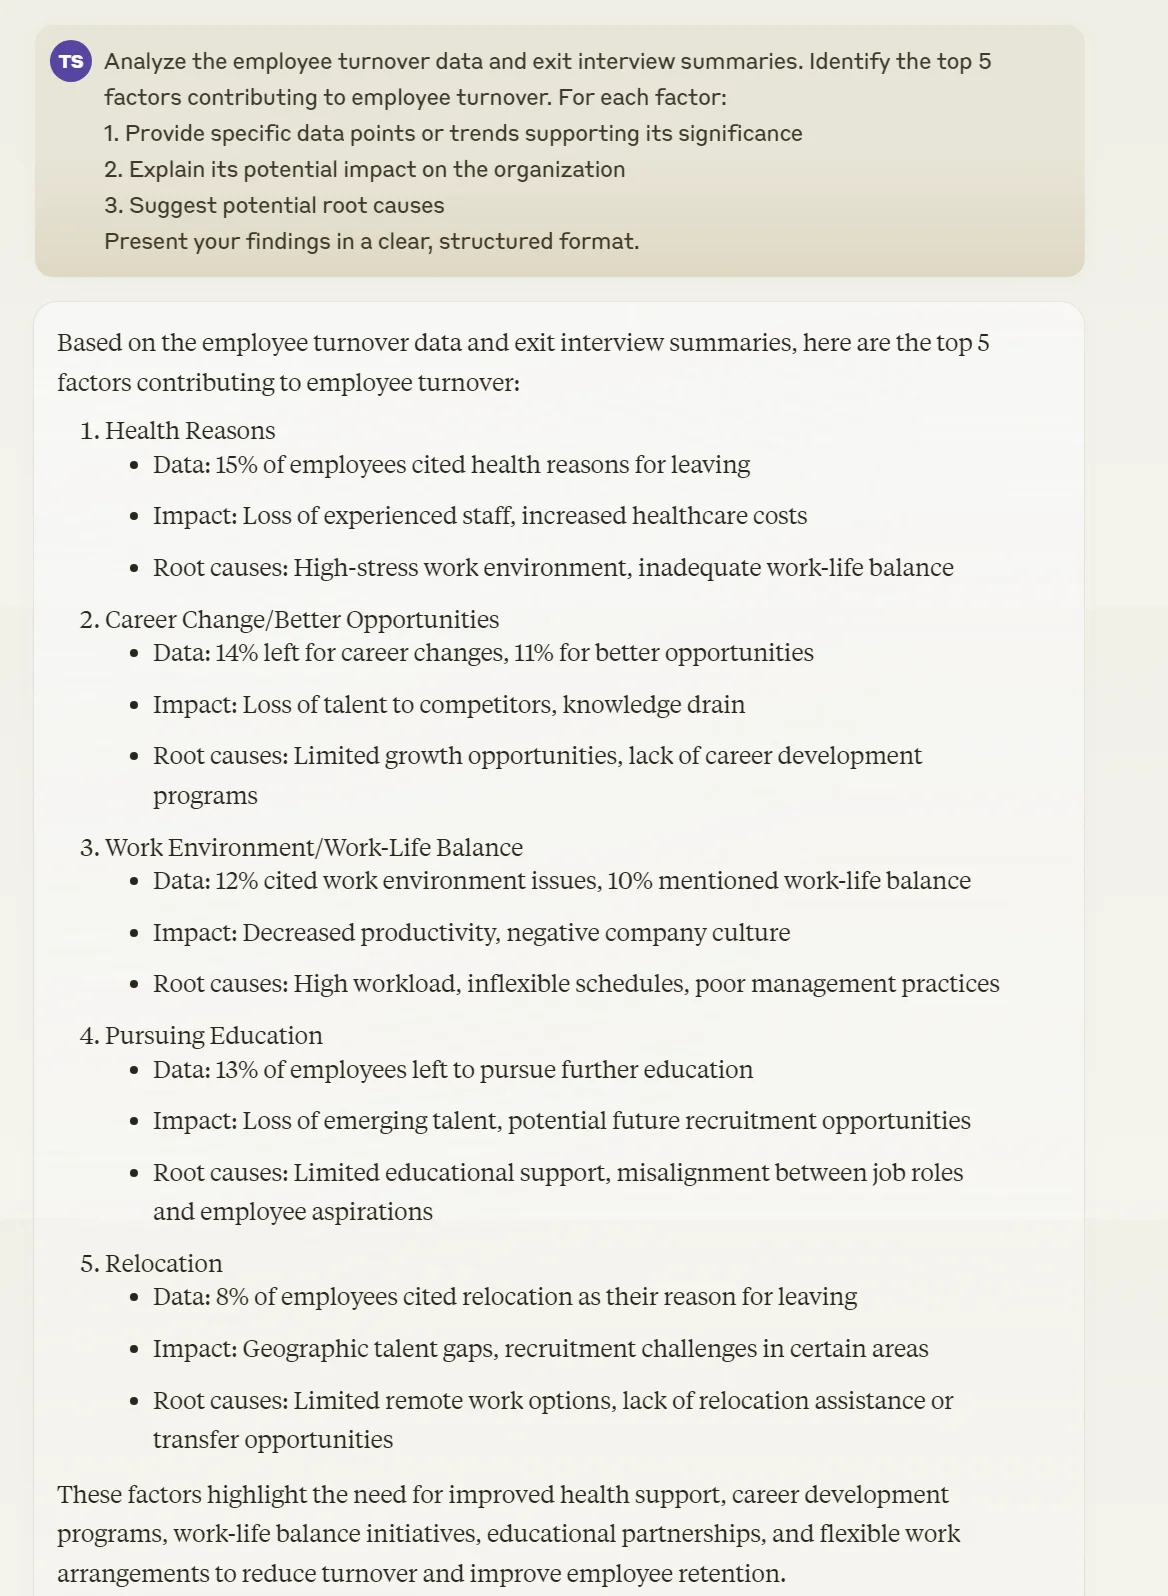
Analyze the employee turnover data and exit interview summaries. Identify the top 5 factors contributing to employee turnover. For each factor:
1. Provide specific data points or trends supporting its significance
2. Explain its potential impact on the organization
3. Suggest potential root causes
Present your findings in a clear, structured format.
Step 2: Crunch the turnover numbers
Raw data is useless without context. We need to calculate key metrics to understand the scale of the problem and identify trouble spots. These numbers will show you exactly where turnover is hitting the hardest.
Use this prompt:
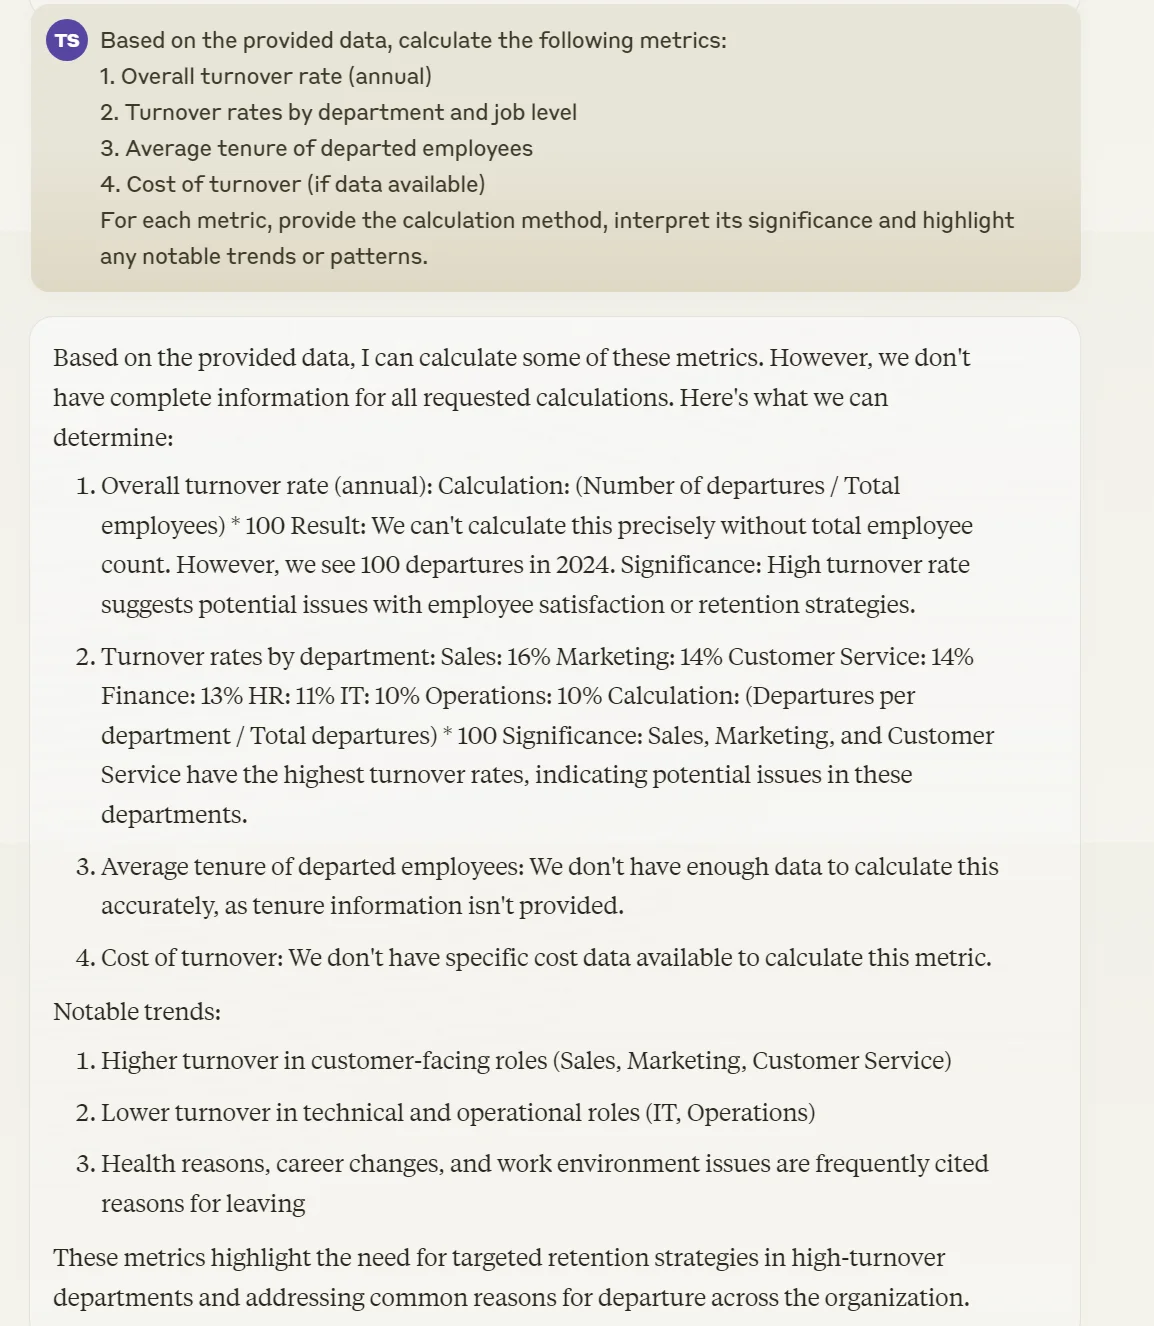
Based on the provided data, calculate the following metrics:
1. Overall turnover rate (annual)
2. Turnover rates by department and job level
3. Average tenure of departed employees
4. Cost of turnover (if data is available)
For each metric, provide the calculation method, interpret its significance and highlight any notable trends or patterns.
Step 3: Identify high-risk areas and employees
Now that we have the big picture, Let’s zoom in on the danger zones. We need to pinpoint exactly where turnover is hitting hardest and who's most likely to jump ship next. This step combines quantitative analysis with insights from exit interviews to create a turnover risk profile.
Prompt Claude with:
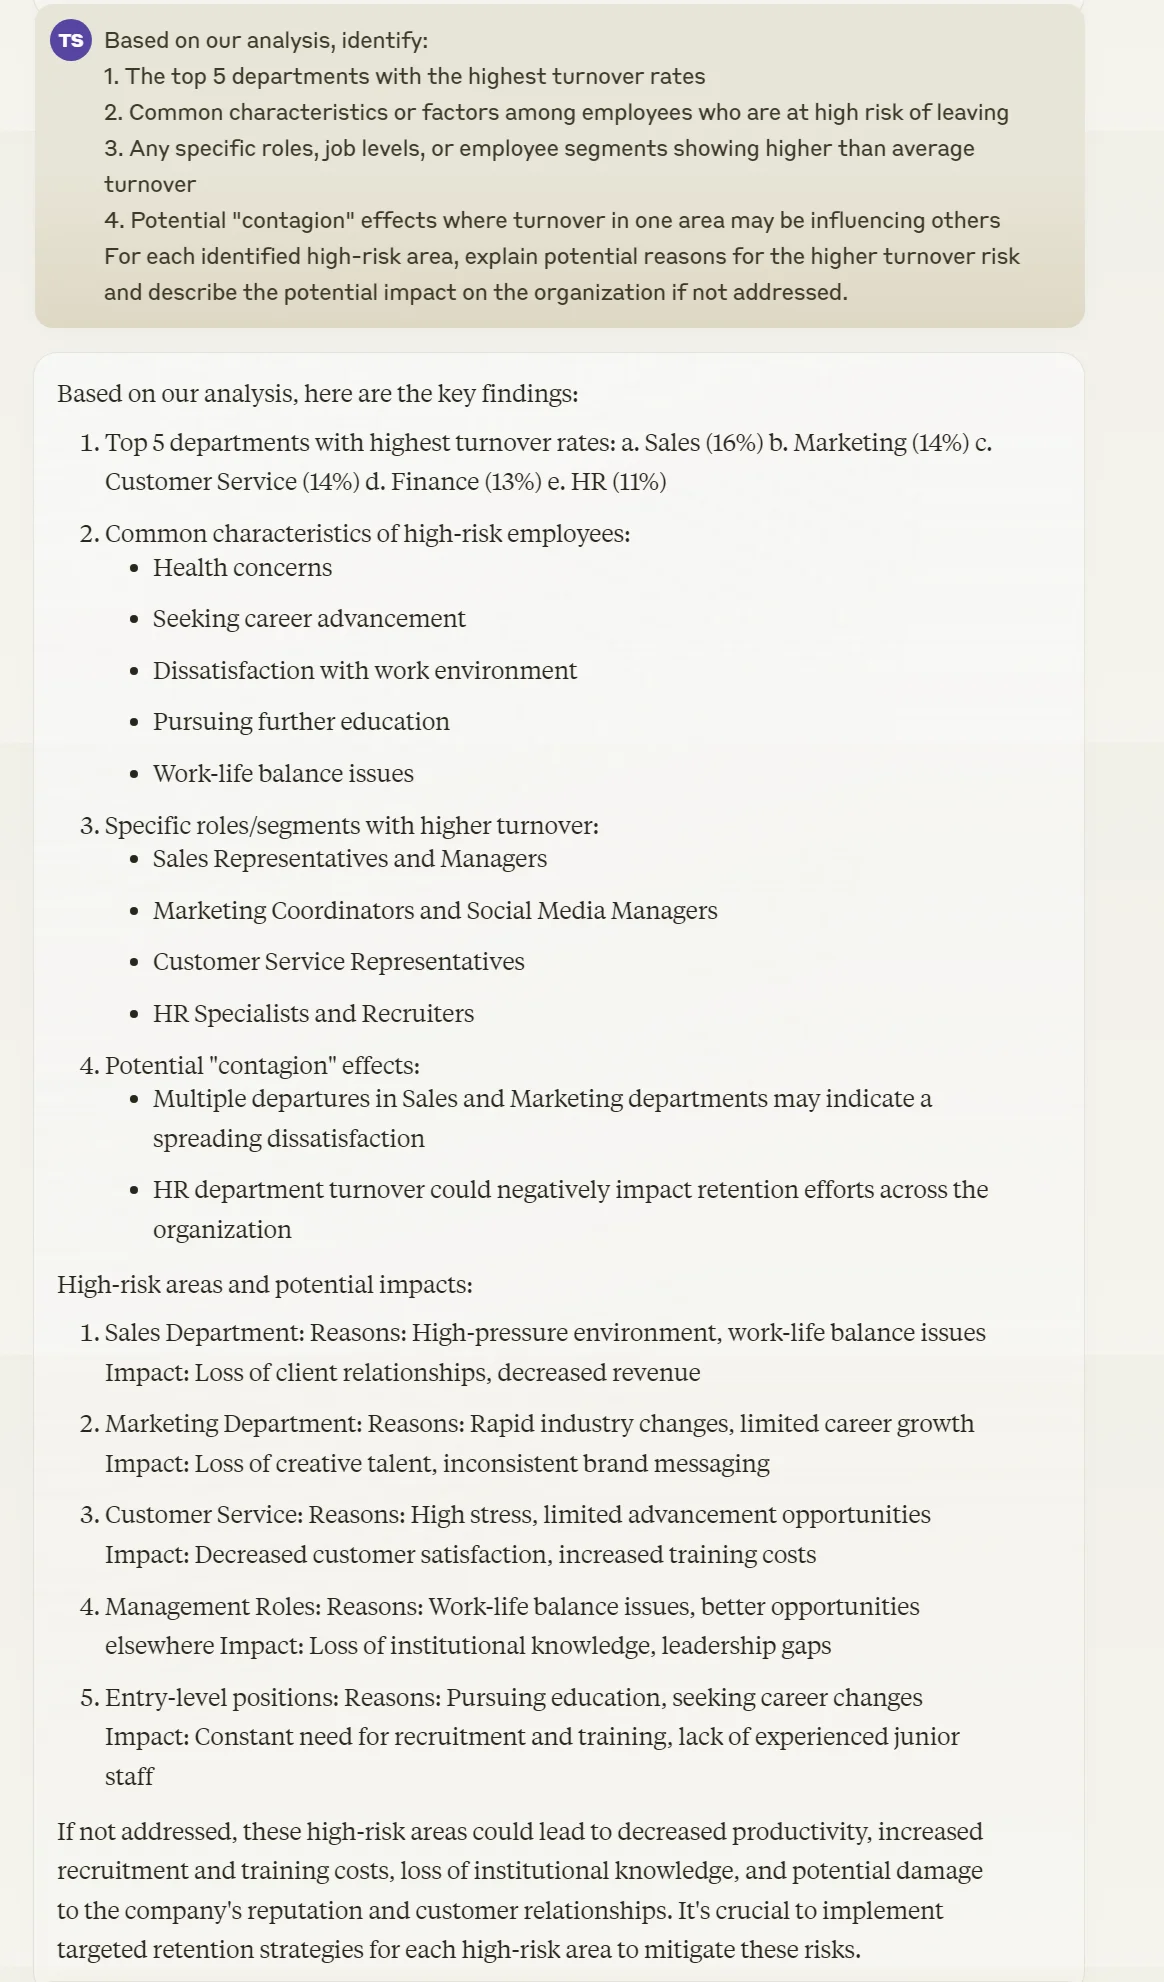
Based on our analysis, identify:
1. The top 5 departments with the highest turnover rates
2. Common characteristics or factors among employees who are at high risk of leaving
3. Any specific roles, job levels, or employee segments showing higher than average turnover
4. Potential "contagion" effects where turnover in one area may be influencing others
For each identified high-risk area, explain potential reasons for the higher turnover risk and describe the potential impact on the organization if not addressed.
Step 4: Predict future turnover trends
Looking at common traits of at-risk employees helps you spot red flags before it's too late. This could be anything from tenure milestones to recent performance review scores to engagement survey responses. This analysis will help you get proactive about retention.
Use this prompt in Claude:
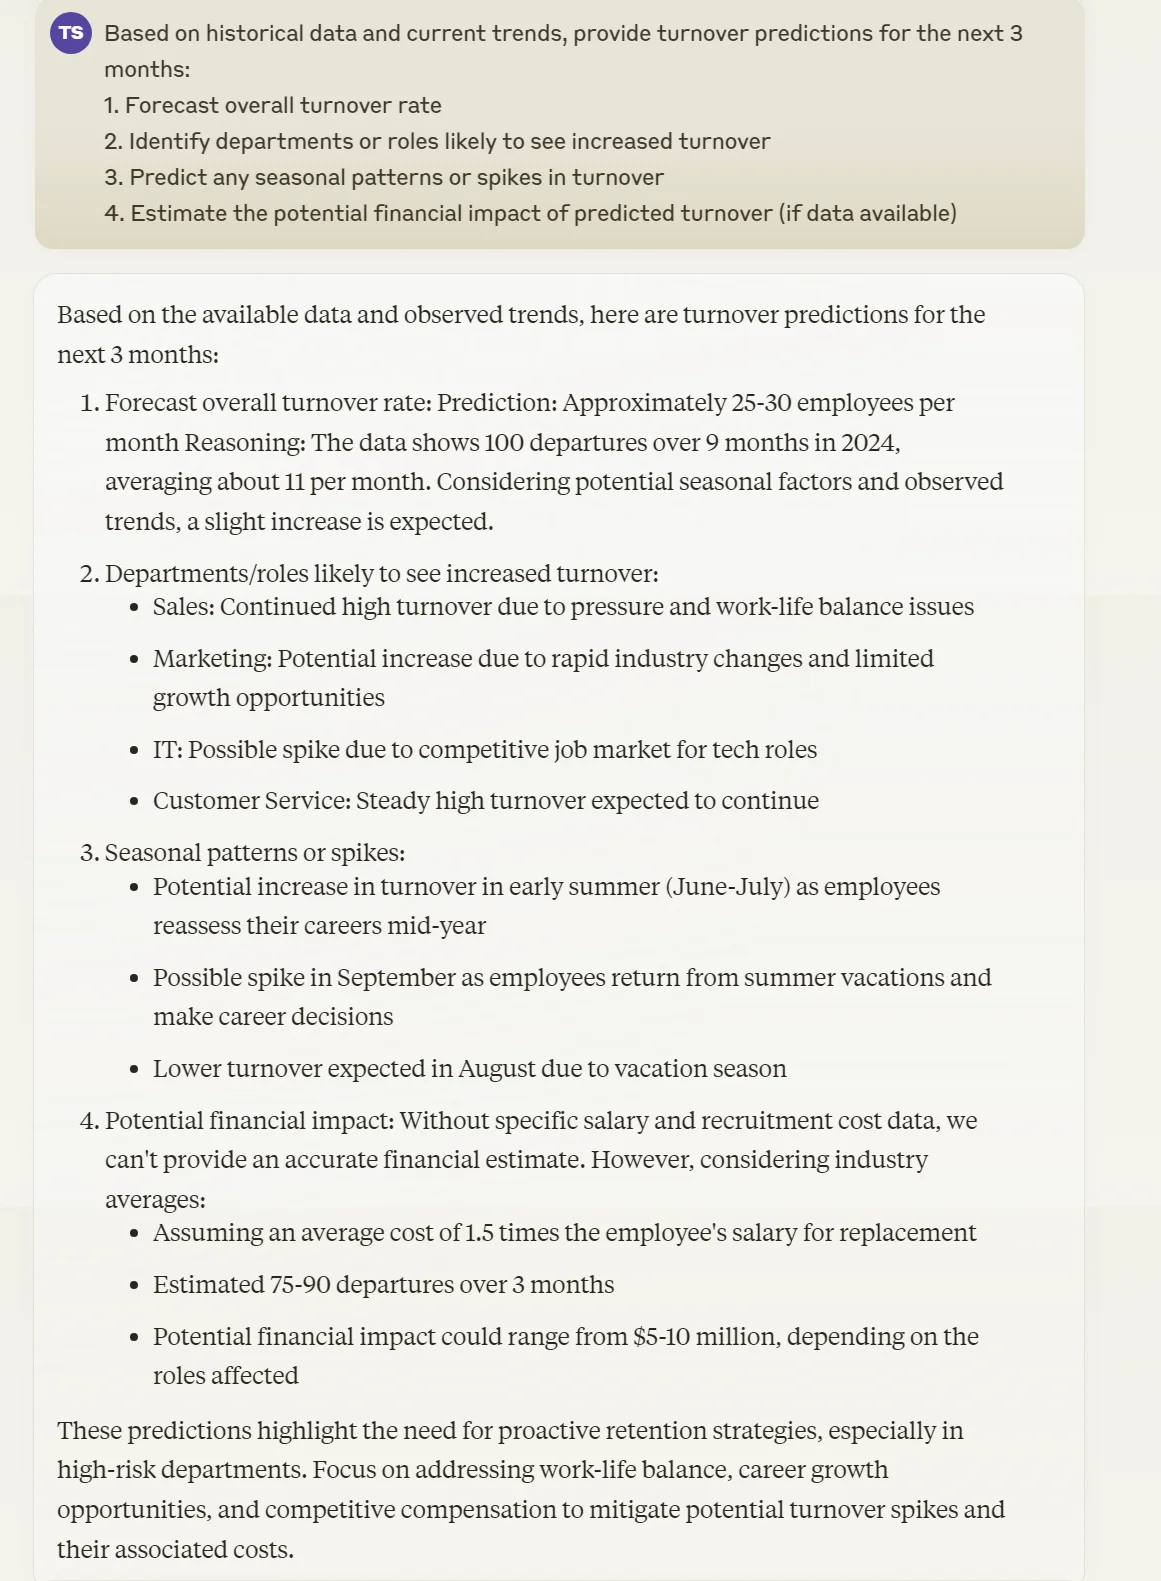
Based on historical data and current trends, provide turnover predictions for the next 3 months:
1. Forecast overall turnover rate
2. Identify departments or roles likely to see increased turnover
3. Predict any seasonal patterns or spikes in turnover
4. Estimate the potential financial impact of predicted turnover (if data is available)
Step 5: Generate tailored retention strategies
We've done the analysis, crunched the numbers, and identified the risks. Now it's time to do something about it. We’ll use Claude to generate retention strategies to improve the turnover ratio, and actionable steps to work upon.
Use this prompt:
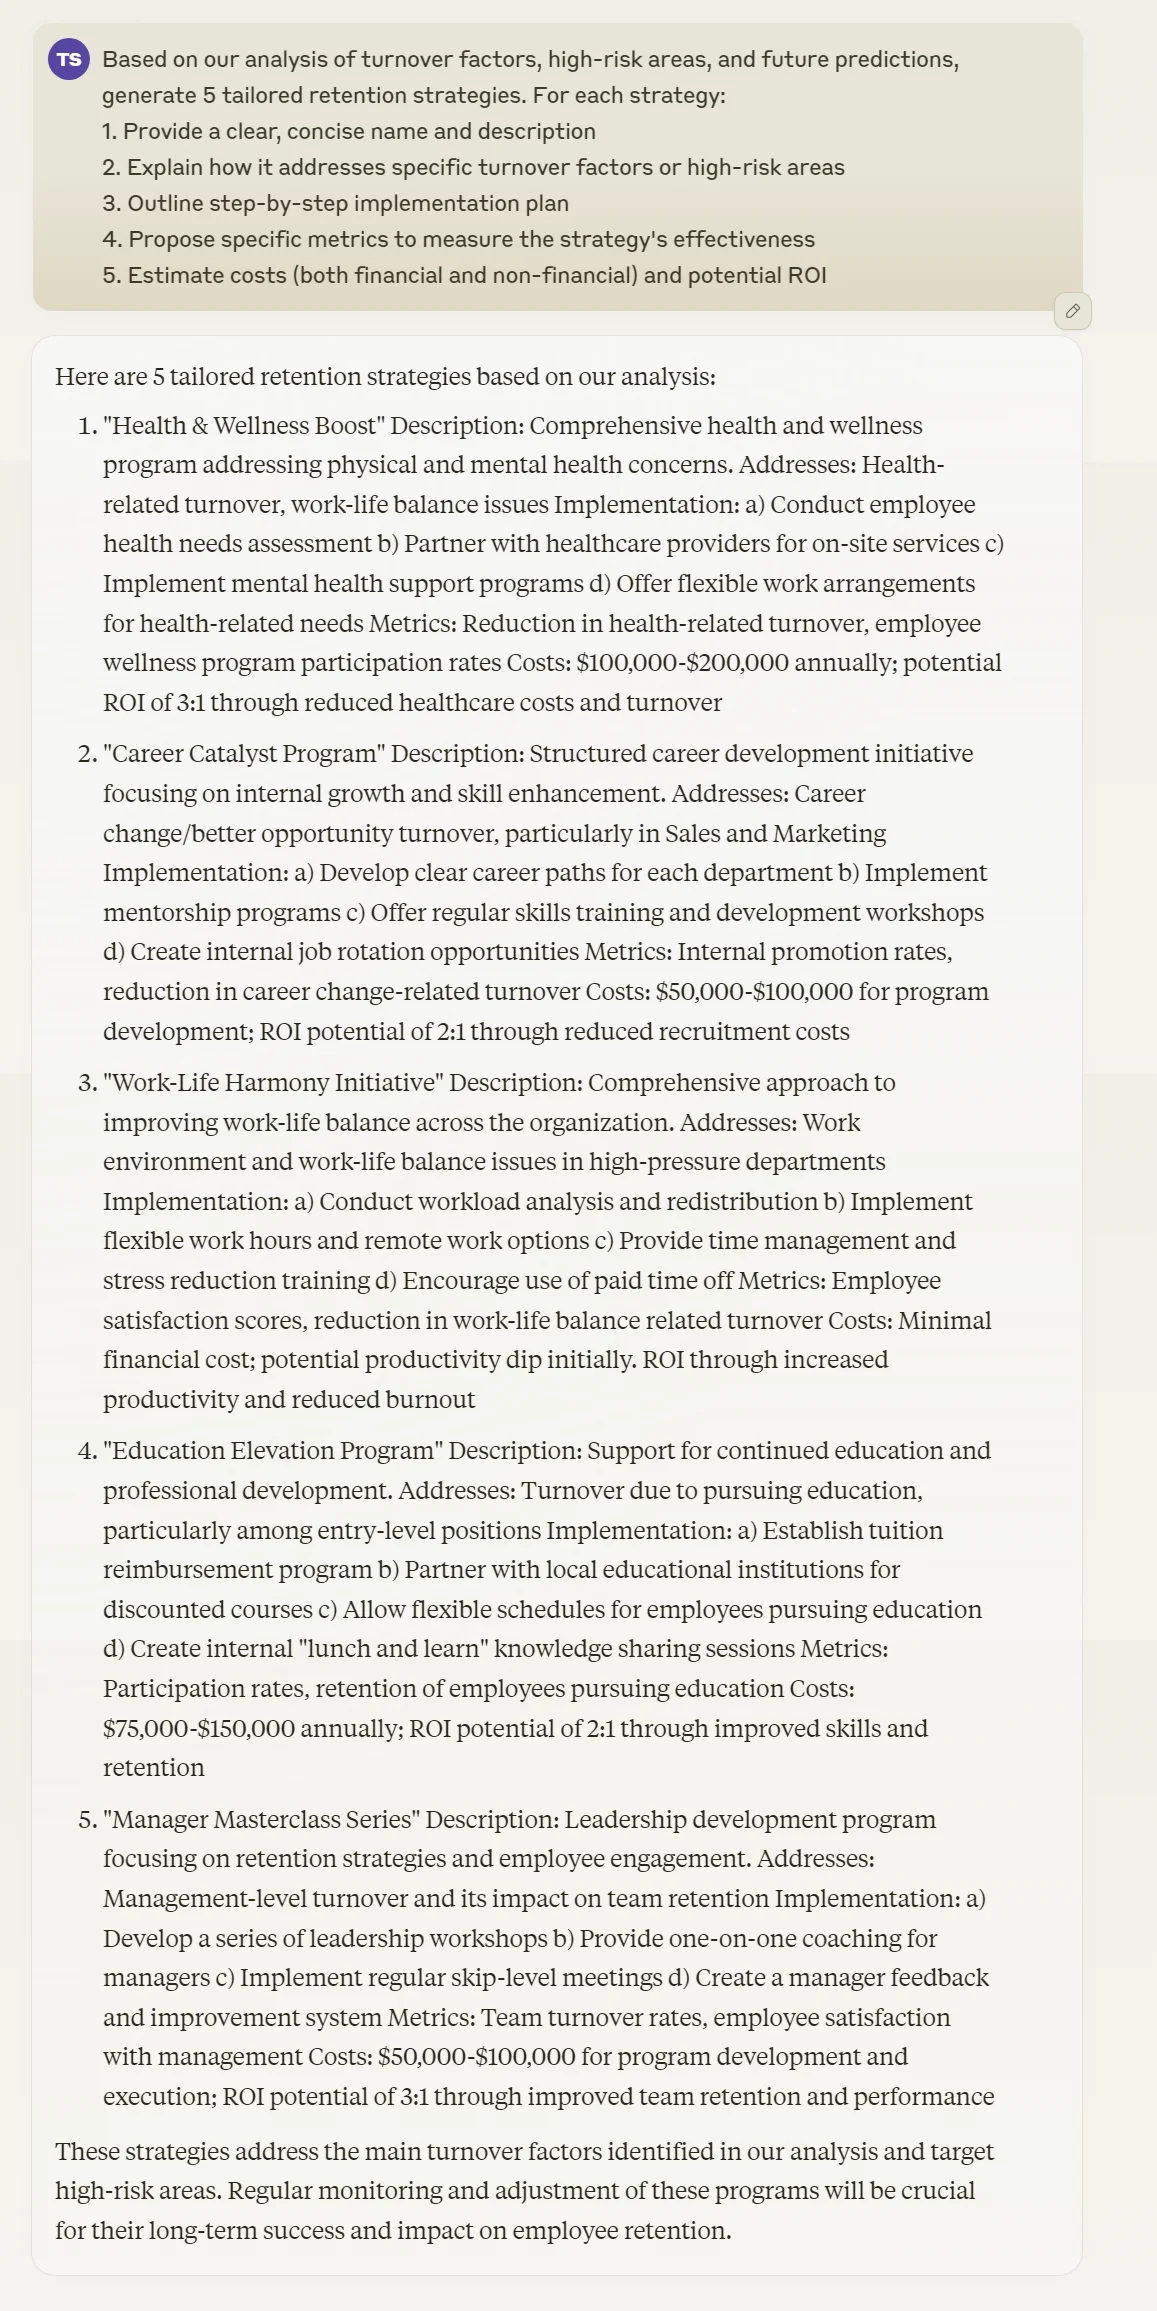
Based on our analysis of turnover factors, high-risk areas, and future predictions, generate 5 tailored retention strategies. For each strategy:
1. Provide a clear, concise name and description
2. Explain how it addresses specific turnover factors or high-risk areas
3. Outline step-by-step implementation plan
4. Propose specific metrics to measure the strategy's effectiveness
5. Estimate costs (both financial and non-financial) and potential ROI
These strategies are your roadmap to slashing turnover and keeping your best people. They're not one-size-fits-all solutions - they're tailored to your specific situation, based on the data and analysis we've done.
Remember to regularly update your Claude project with new turnover data and exit interview insights. This keeps your analysis fresh and lets you track how well your retention strategies are working over time.
This tutorial was created by Tanmay.