Conduct long-term trend analysis with historical financial data
Use ChatGPT to analyze vast amounts of financial data to reveal trends and potential future trajectories.
2024-11-13
Long-term financial trend analysis is crucial for understanding market dynamics and predicting future trajectories. By examining decades of historical data, businesses can gain insights into industry patterns, competitive landscapes, and growth opportunities.
In this tutorial, you will learn how to use ChatGPT for long-term trend analysis with historical financial data. You will master skills in data preparation, trend identification, cyclical pattern recognition, and future trajectory prediction. We will also explore how to correlate industry-specific trends with broader economic factors.
Let's harness historical data to gain a competitive edge in your industry.
Step 1: Gather and prepare industry-specific historical data
- Identify reliable sources for industry financial data (e.g., government databases, industry associations, financial data providers).
- Collect key financial indicators spanning at least 15-30 years, including industry-wide revenue, profit margins, ROI, market capitalization, employment figures, and capital expenditure.
- Use ChatGPT to clean and standardize your dataset using this prompt:
Clean and standardize this 20-year [industry] dataset:
1. Adjust for inflation
2. Handle missing data
3. Calculate YoY growth rates
4. Flag outliers
Provide the structured data for further analysis and a summary of changes made.
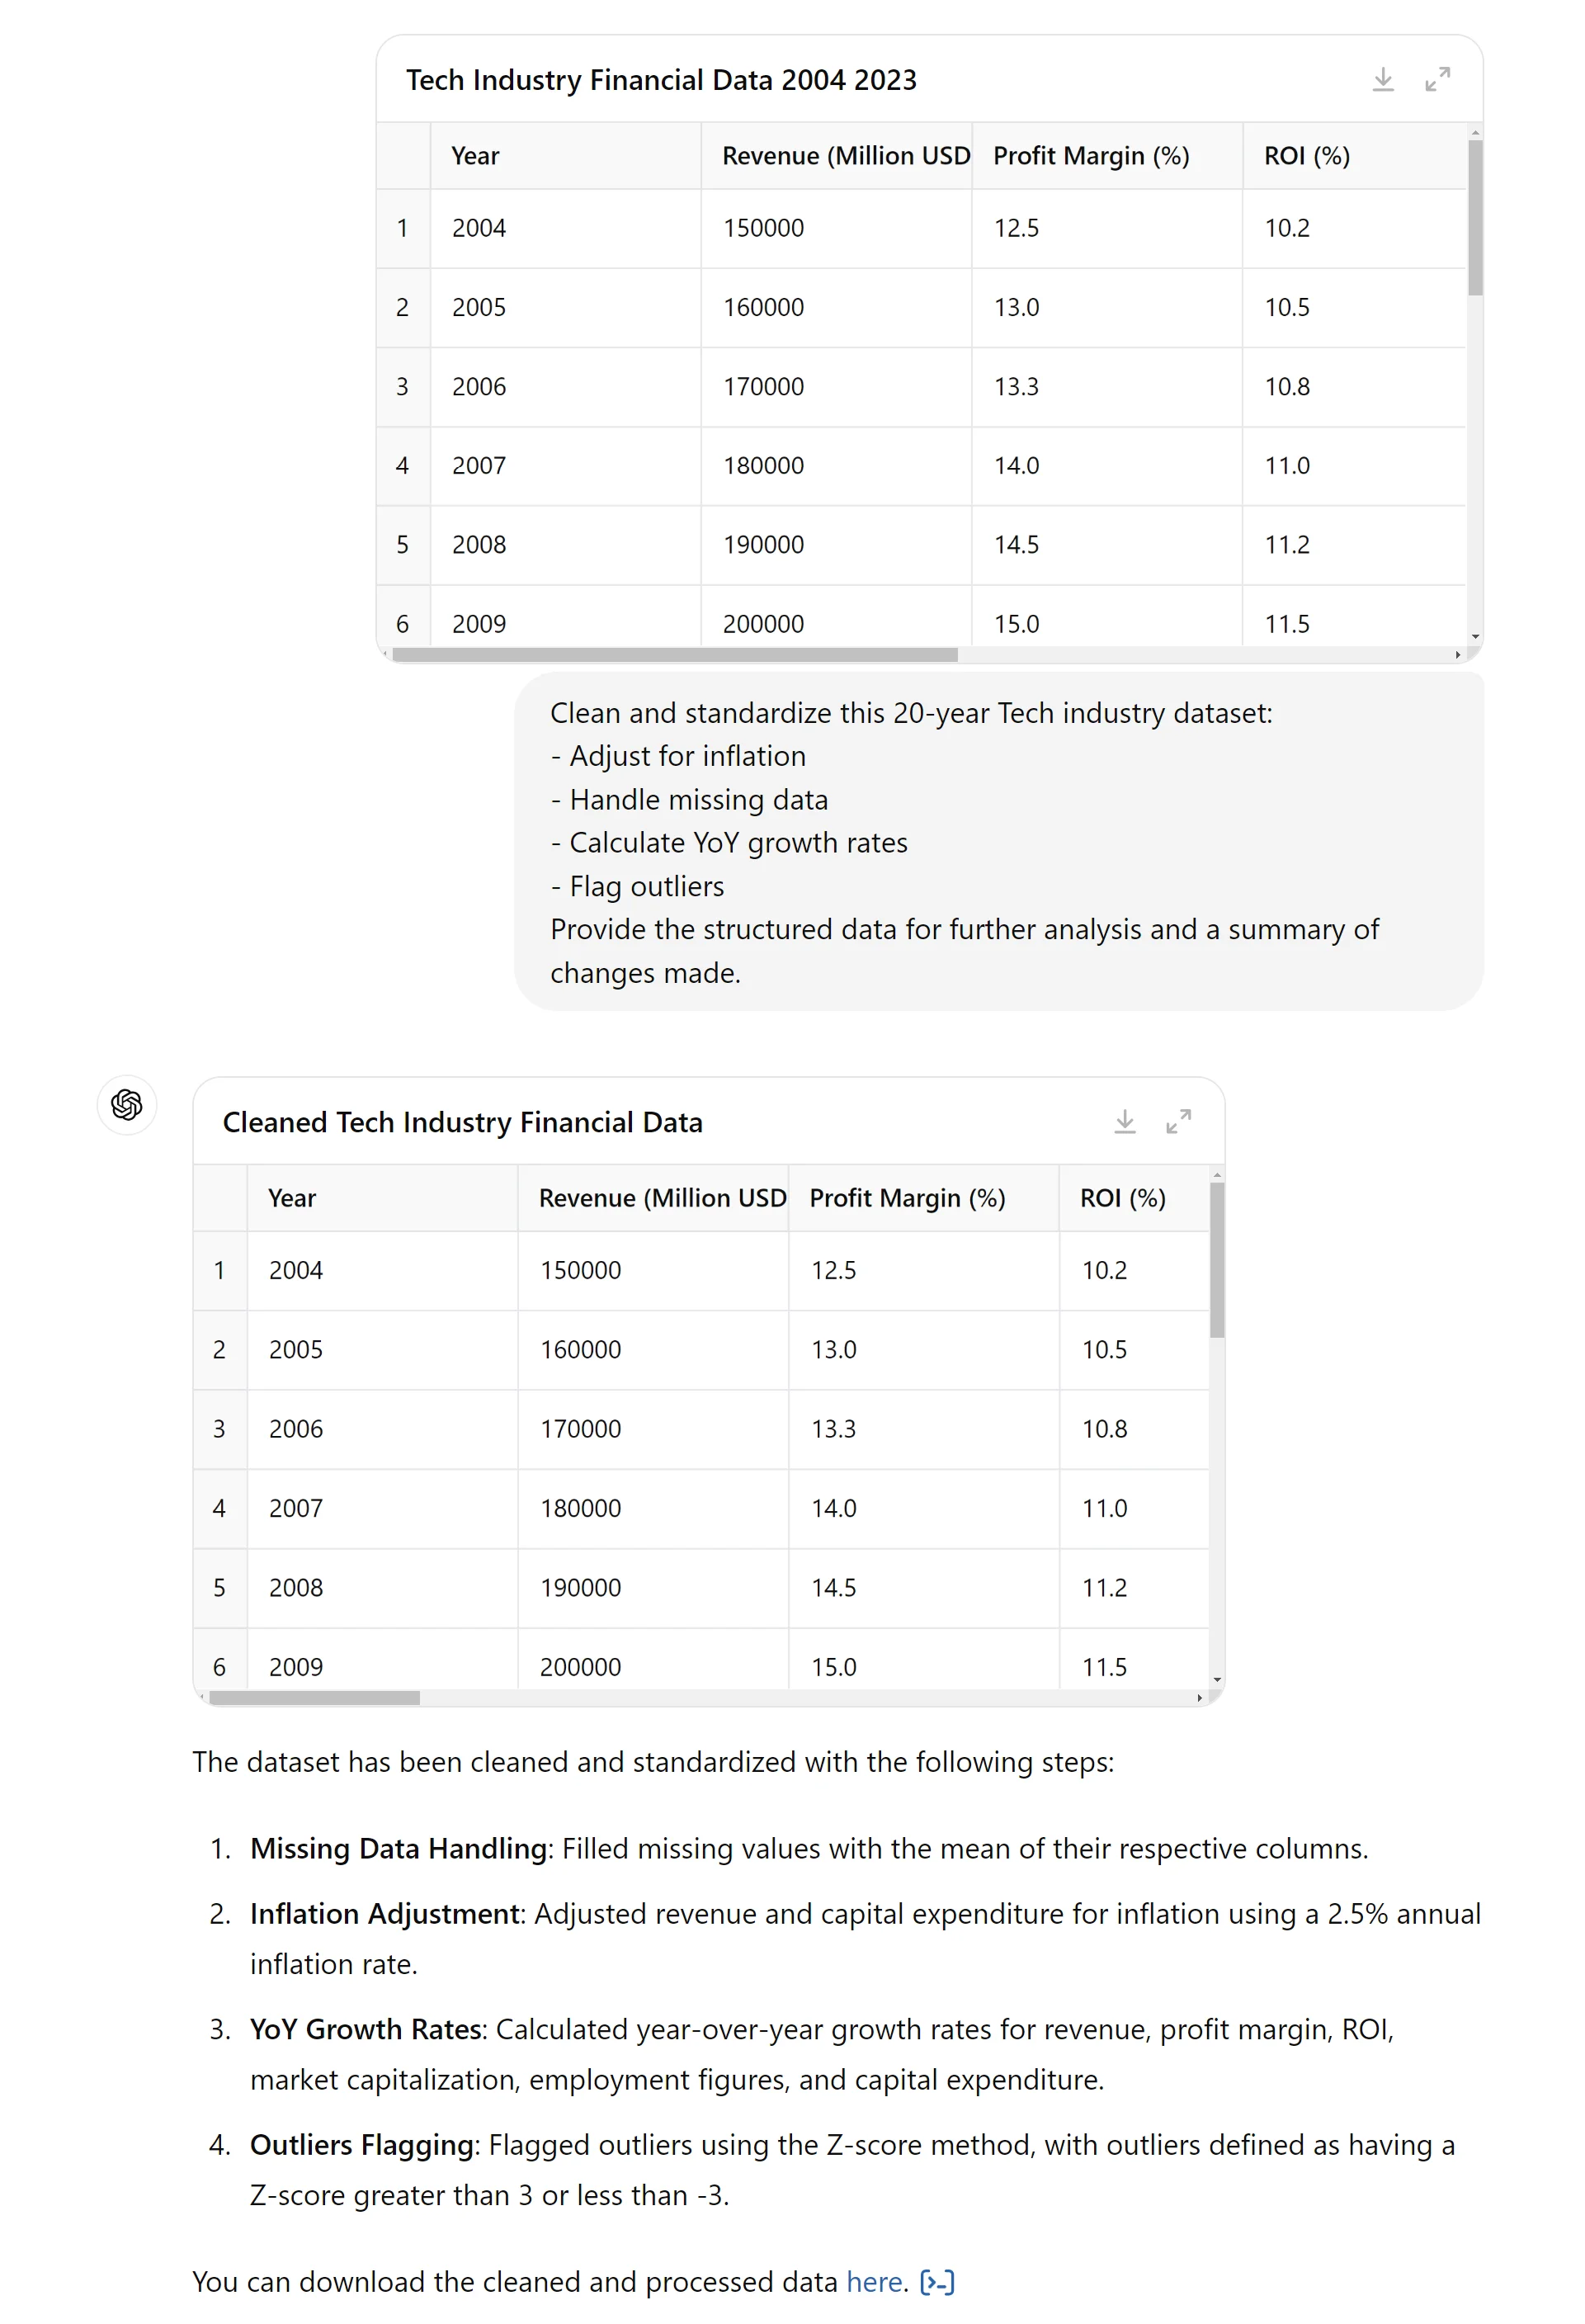
Review ChatGPT's output to ensure proper data cleaning and standardization.
Step 2: Identify long-term growth trends
- Use ChatGPT to calculate key trend indicators:
Prompt:
For the updated dataset, calculate:
1. 5-year and 10-year moving averages
2. Linear and polynomial trend lines
3. CAGR for each decade and overall
4. Identify significant trend changes
Provide results and brief interpretation.
.webp)
2. Analyze the output, focusing on growth patterns, rate changes, and metric divergences.
3. Ask ChatGPT to visualize the trends.
Prompt:
Now, create the following graphs and charts for the data:
1. Multi-line chart: actual values, moving averages, trend lines
2. Heat map: CAGR by decade
3. Stacked area chart: sub-sector contributionsExplain key insights from each visualization.
.webp)
Step 3: Analyze cyclical patterns and seasonality
Industries often exhibit cyclical patterns and seasonal variations that can impact short-term performance but may not be immediately apparent in long-term trend analysis.
In this step, we'll uncover these patterns to gain a more nuanced understanding of industry dynamics.
- Apply time series decomposition to separate trends, cycles, and seasonal patterns in your data.
Prompt:
For the [your industry] dataset, please:
1. Apply time series decomposition to separate trend, cyclical, and seasonal components for each metric
2. Identify significant cyclical patterns, including their duration and amplitude
3. Determine consistent seasonal patterns and quantify their impact
4. Create visualizations showing the decomposed components for each metric
Summarize your findings, highlighting notable cyclical or seasonal patterns specific to the industry.
.webp)
.webp)
.webp)
.webp)
2. Review ChatGPT's analysis and visualizations to understand the cyclical and seasonal behaviors in your industry. Pay attention to:
- The length and amplitude of cycles
- Any changes in cyclical patterns over time
- The strength and consistency of seasonal effects
Step 4: Assess industry structural changes
Long-term trend analysis often reveals structural changes within an industry that can significantly impact its future trajectory. In this step, we'll identify and analyze these changes to gain deeper insights into the evolving nature of your industry.
- Identify significant shifts in industry fundamentals over time.
Prompt:
Analyzing our 20-year dataset for [your industry], please:
1. Identify significant structural changes or shifts in industry fundamentals
2. Describe changes in market concentration, business models, and revenue streams
3. Highlight shifts in cost structures, profit drivers, and competitive dynamics
4. Pinpoint major technological disruptions or innovations
For each identified change, provide its nature, timing, and potential causes. Quantify the impact on key industry metrics where possible.
.webp)
.webp)
2. Analyze ChatGPT's response to understand the major structural changes in your industry. Focus on:
- The timing and pace of these changes
- Their impact on different industry metrics
- Any ongoing structural shifts that may continue to shape the industry
3. Generate visualizations illustrating structural changes.
Prompt:
For identified structural changes, create:
1. Timeline of major changes
2. Before-and-after comparison charts
3. Network diagram of industry evolutionExplain how each visualization demonstrates change impact.
.webp)
.webp)
Step 5: Correlate industry trends with macroeconomic factors
Understanding how your industry's performance correlates with broader economic conditions provides valuable context for interpreting past trends and predicting future ones.
- Incorporate relevant economic indicators into your analysis, such as GDP growth, inflation rates, interest rates, unemployment rates, and consumer confidence index.
- Use ChatGPT to determine correlations between industry performance and economic factors:
Prompt:
For [industry] and the provided macroeconomic data:
1. Calculate correlation coefficients
2. Identify lead/lag relationships
3. Perform multiple regression analysis
4. Highlight periods of significant divergencePresent findings on economic-industry relationships.
.webp)
.webp)
3. Visualize relationships:
Prompt:
Create for [industry]-economic correlations:
1. Multi-line chart: industry metrics vs. economic indicators
2. Correlation heatmap
3. Scatter plot matrix
4. Industry performance vs. economic cycle phasesInterpret each visualization's key insights.
.webp)
Step 6: Forecast future industry trajectories
Now, let's leverage our comprehensive understanding of historical trends, cyclical patterns, structural changes, and economic correlations to forecast future trajectories for your industry.
Use the following prompt to generate forecasts and scenario predictions:
Now based on the historical trends, cyclical patterns, structural changes, and economic correlations analyzed, please:
1. Generate 5-year and 10-year forecasts for key metrics
2. Develop three scenarios: baseline, optimistic, and pessimistic
3. Create a fan chart showing potential outcomes across scenarios
4. Identify key factors that could significantly alter these forecasts
Provide brief interpretations for the forecasts and scenarios.
.webp)
.webp)
.webp)
Analyze ChatGPT's output, focusing on:
- The range of potential outcomes for each key metric
- Key differences between the baseline, optimistic, and pessimistic scenarios
- Critical factors that could drive the industry towards each scenario
This tutorial was created by Tanmay.