Create an interactive dashboard builder
How to use Claude Projects to create an interactive dashboard that helps you visualize data.
2024-12-06
For our first mini-app build with Claude, we’re going to create an interactive dashboard builder. This is a great use case for Claude Artifacts and Projects, as a team of data analysts, or even non-data folk, can use these tools to quickly visualize and share data from underlying raw data, going from CSVs to graphs, charts, and interactive data widgets in minutes.
Steps we’ll follow in this tutorial:
- Enable the Artifacts feature
- Create a Claude Project
- Set custom instructions
- Test the Project
Enable the Artifacts feature
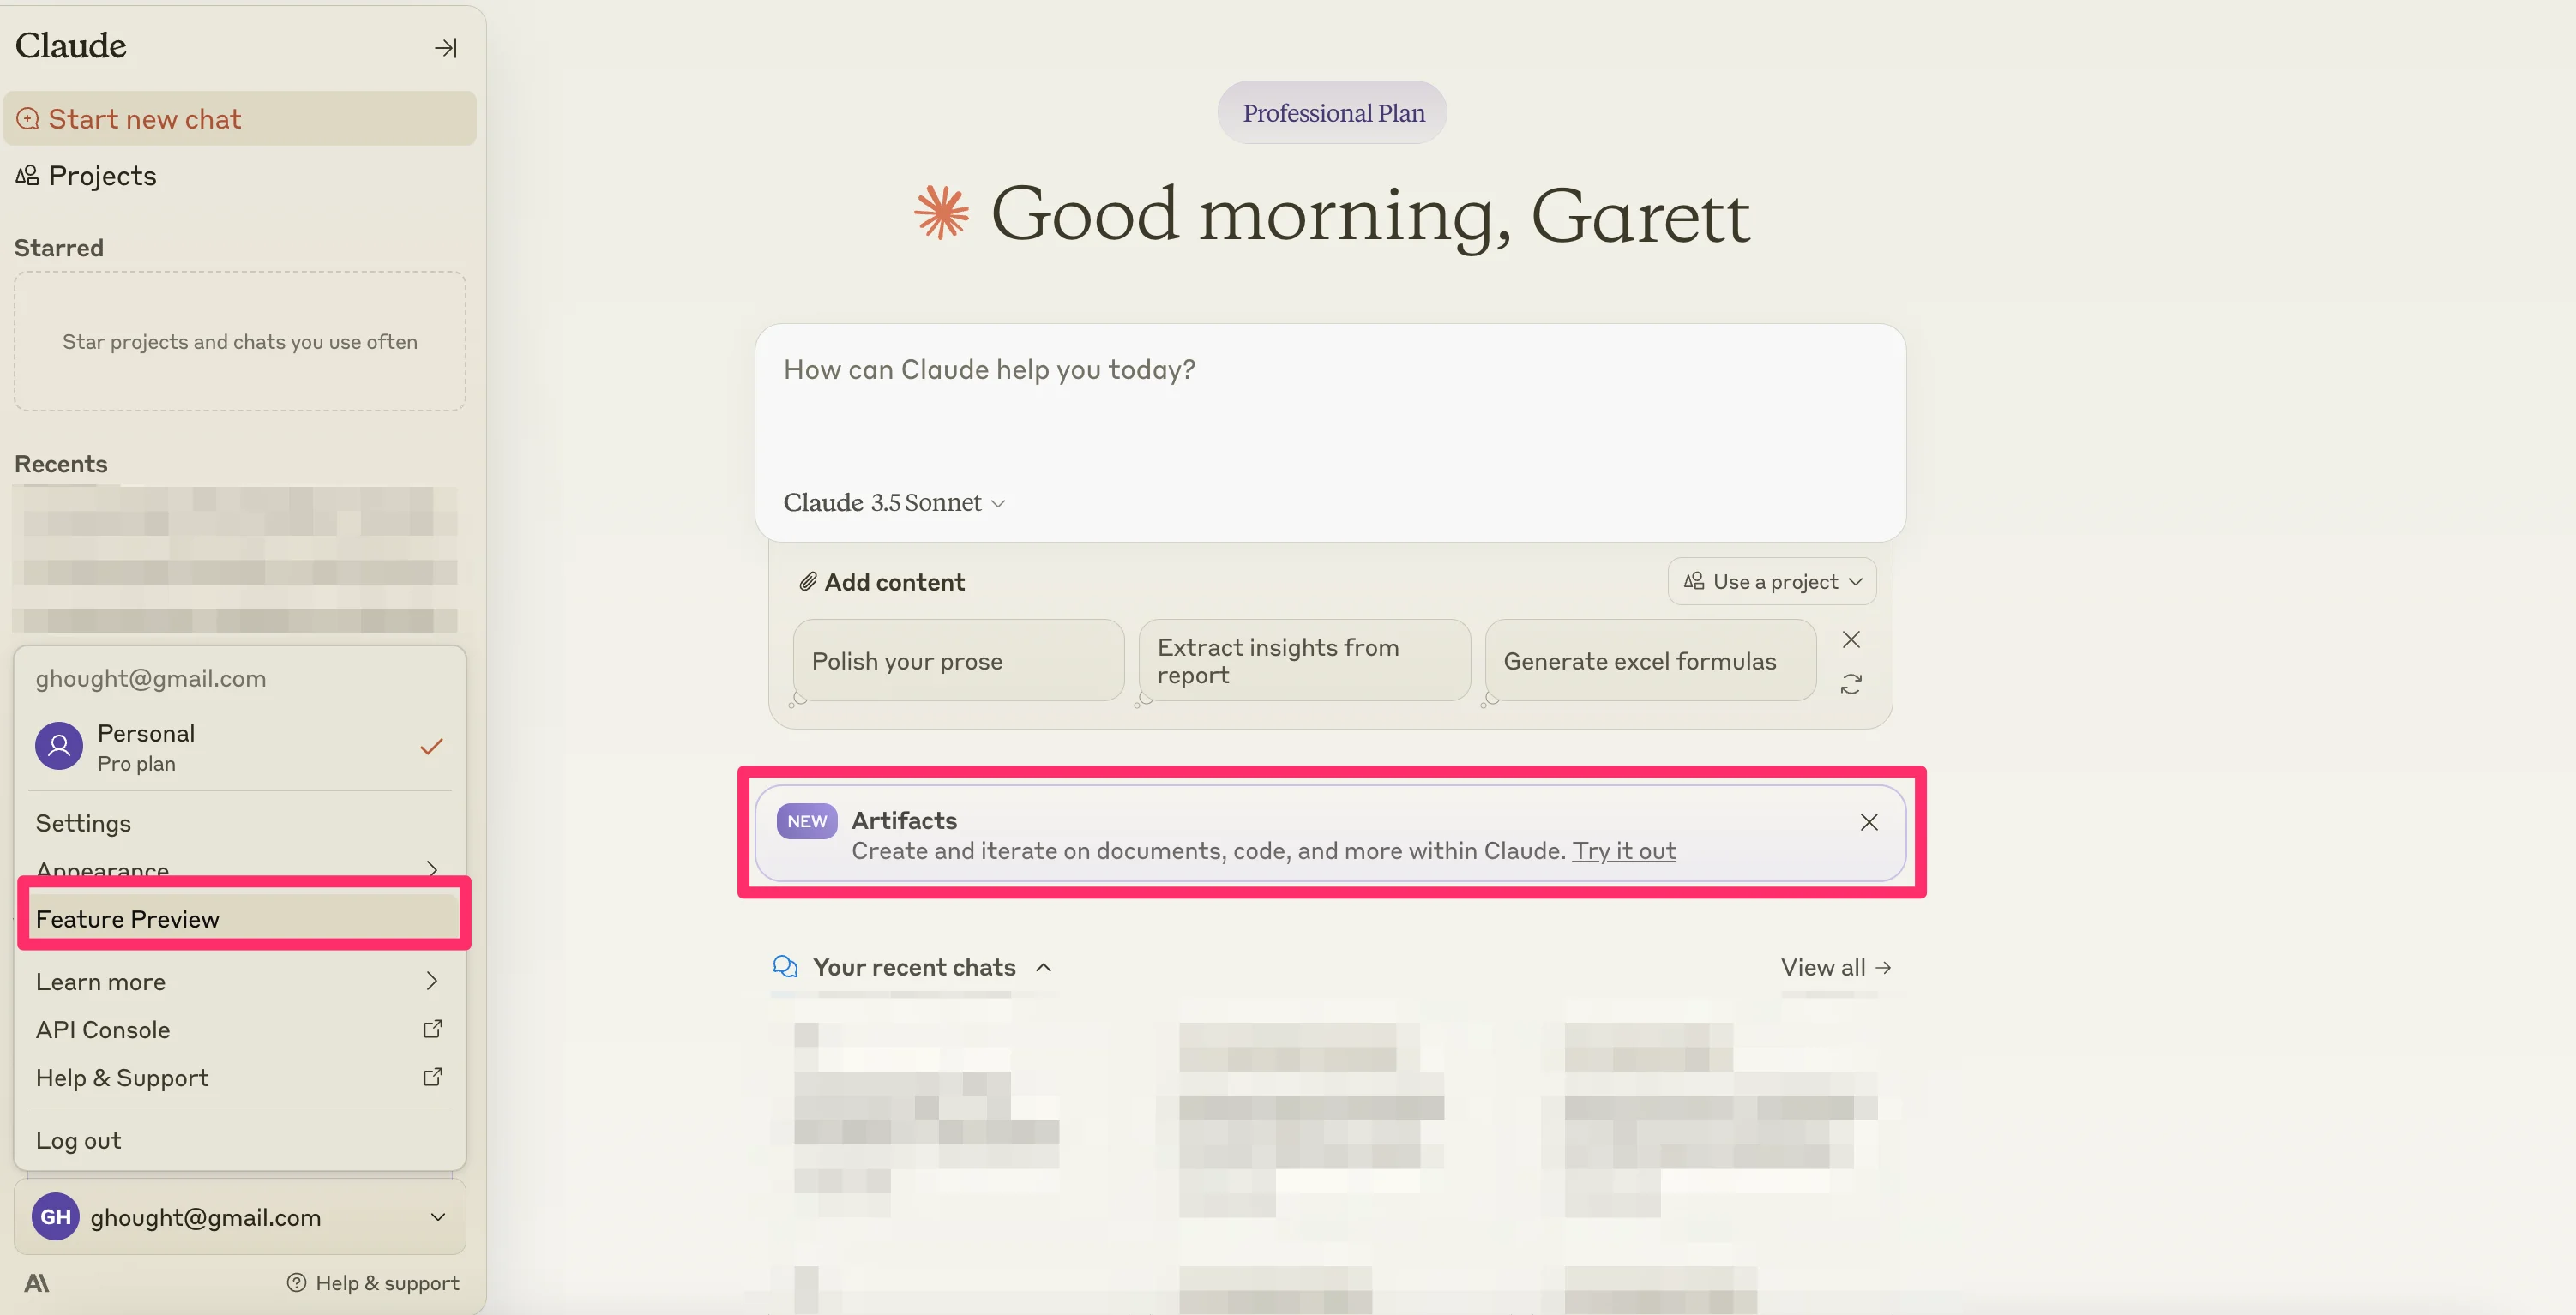
To get started, you need to enable the new Artifacts Feature Preview. To do this, on the Claude homepage, click on the dropdown on your email at the bottom of the left-side navigation and click the “Feature Preview” option.
Alternatively, there might be a purple toast on the main page as well, which you can click to access the Artifacts feature preview.
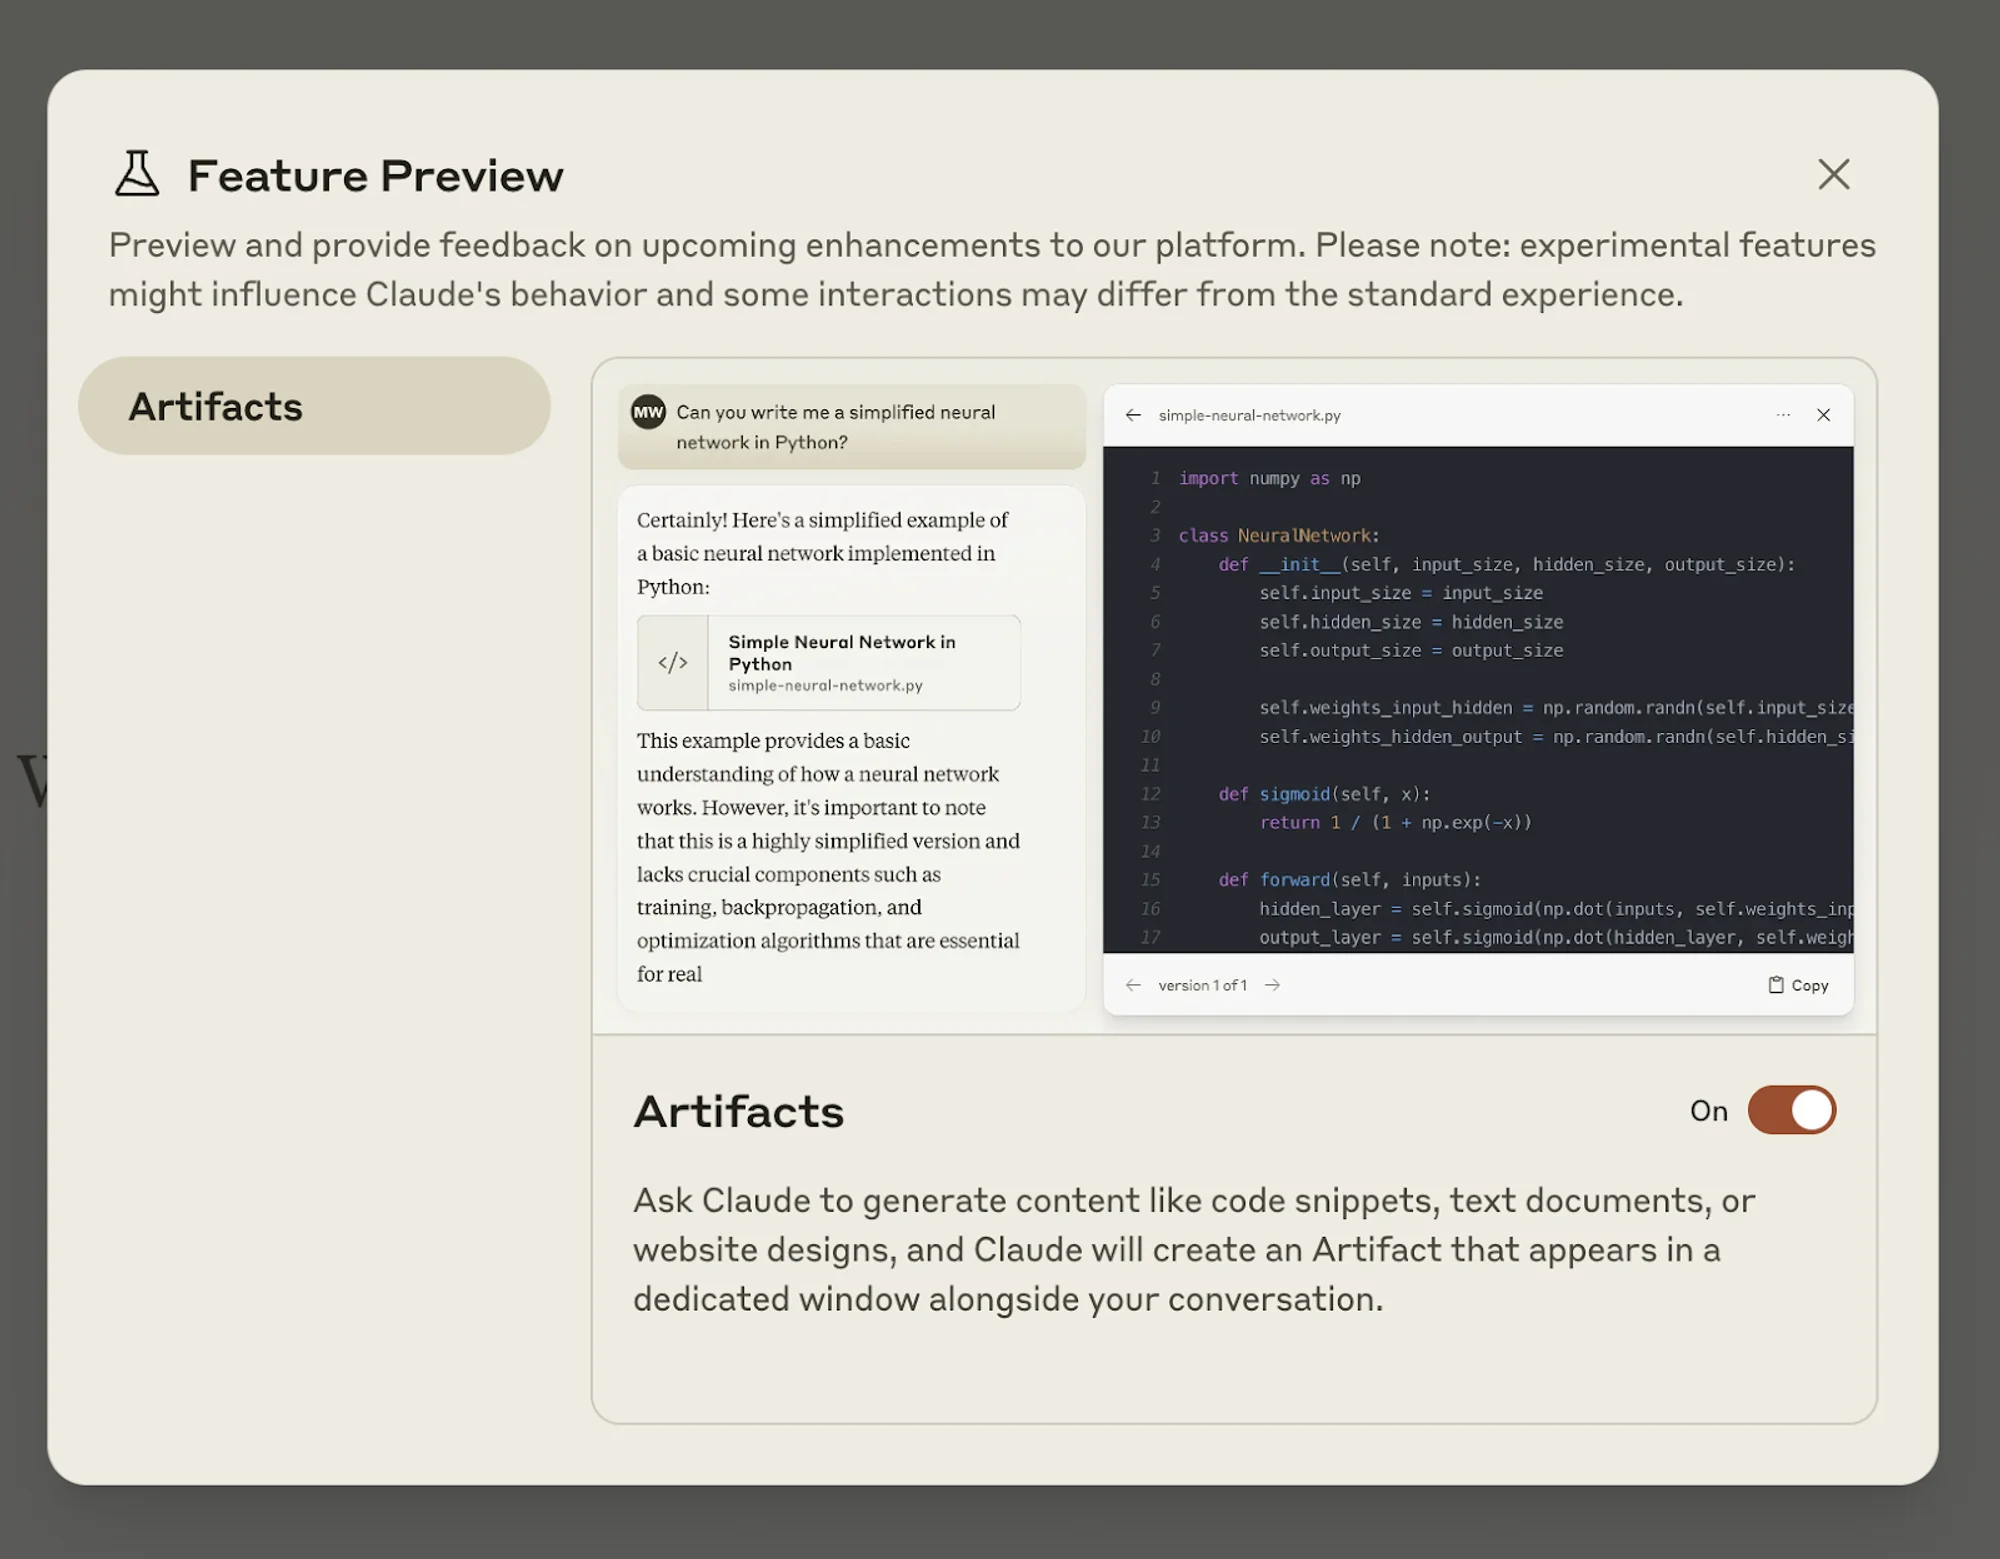
The Feature Preview window will open. Toggle the Artifacts feature “On” to enable the feature. When you enable Artifacts, it will be enabled by default for your future chats.
Create a Claude Project
Once Artifacts is enabled, the next thing we need to do is create a Project. To do this, click on the “Projects” tab in the left-side navigation.
.webp)
This will take you to the Claude Projects page. Click the “Create Project” button in the top right corner to create a Project.
.webp)
You will then be asked to give your project a name and description. These are what you’ll see on the Projects page to identify the Project, so it’s helpful to be descriptive and concise with these entries.
.webp)
Set custom instructions
Once you’ve created the Project, you’ll be taken to the Project editing page. This is where you can set custom instructions, add Project knowledge, and test the bot. To start, we’re going to add custom instructions. To do this, click the “Set custom instructions” link on the right side of the page.
.webp)
We’re going to add a detailed custom instruction that uses a “Chain-of-Thought” style prompt technique to take uploaded data and transform it into an interactive dashboard.
Custom instructions:
You are an AI assistant tasked with generating an interactive dashboard based on uploaded data. Your goal is to create a visually appealing and informative dashboard that meets the specified requirements. Follow these instructions carefully to complete the task.
First, review the uploaded data.
Next, review the dashboard requirements.
Now, follow these steps to generate the interactive dashboard:
1. Analyze the data:
a. Identify the key variables and their relationships
b. Determine the most relevant metrics and insights
2. Plan the dashboard layout:
a. Decide on the number and arrangement of visualizations
b. Choose appropriate chart types for each metric or insight
3. Create individual visualizations:
For each visualization, specify:
a. Chart type
b. Data variables to be used
c. Any necessary data transformations
d. Color scheme and styling
4. Add interactivity:
a. Specify filters, drill-down options, or other interactive elements
b. Describe how user interactions should affect the displayed data
5. Design the overall dashboard:
a. Determine the layout and positioning of visualizations
b. Choose a cohesive color scheme and styling for the entire dashboard
c. Add any necessary text elements (titles, descriptions, legends)
6. Ensure the dashboard meets all specified requirements
Once you have completed these steps, present your dashboard design as an interactive Artifact.
.webp)
Test your Project
With our custom instructions added, we’re now going to test the Project. To do this, add a prompt to the chat window and attach sample data.
Sample prompt:
Create an interactive dashboard of the attached data.
.webp)
Once our data is uploaded with our prompt, Claude will generate an interactive dashboard of our data in the Artifacts preview window. For this example, it’s added a year filter at the top, data cards below the filter, and interactive graphs at the bottom.
.webp)
Once you’re happy with the dashboard generation, if you’re on a Team plan, you can share this interactive dashboard builder with the rest of the users in your Claude organization. They can then upload data and create interactive dashboards in the same style.
That’s it for this tutorial! In the next lesson, we’re going to use Claude Artifacts and Projects to create a new hire onboarding bot.
This tutorial was created by Garrett.