Create immersive data visualisations with the Claude Analysis Tool
Use Claude’s new Analysis Tool to create data visualisations from spreadsheets.
2024-12-08
With its latest update, Claude can now create code and run it, allowing you to—among other things—carry out a detailed and interactive analysis of your business data.
In this tutorial you will learn how to:
- Create sample sales data to test with
- Create an analysis tool in Claude
- Publish your data visualisation for others to view
You’ll need:
- ChatGPT account
- Claude account.
Let’s see how it’s done.
Step 1: Create sample sales data to test with
You can skip this test if you have some data ready to go in CSV format. But if you want some sample data to use, then ChatGPT is great for this (better than Claude in my experience).
Open ChatGPT, then use a prompt like this.
Please create me CSV file of weekly sales data for an imaginary ice cream shop.
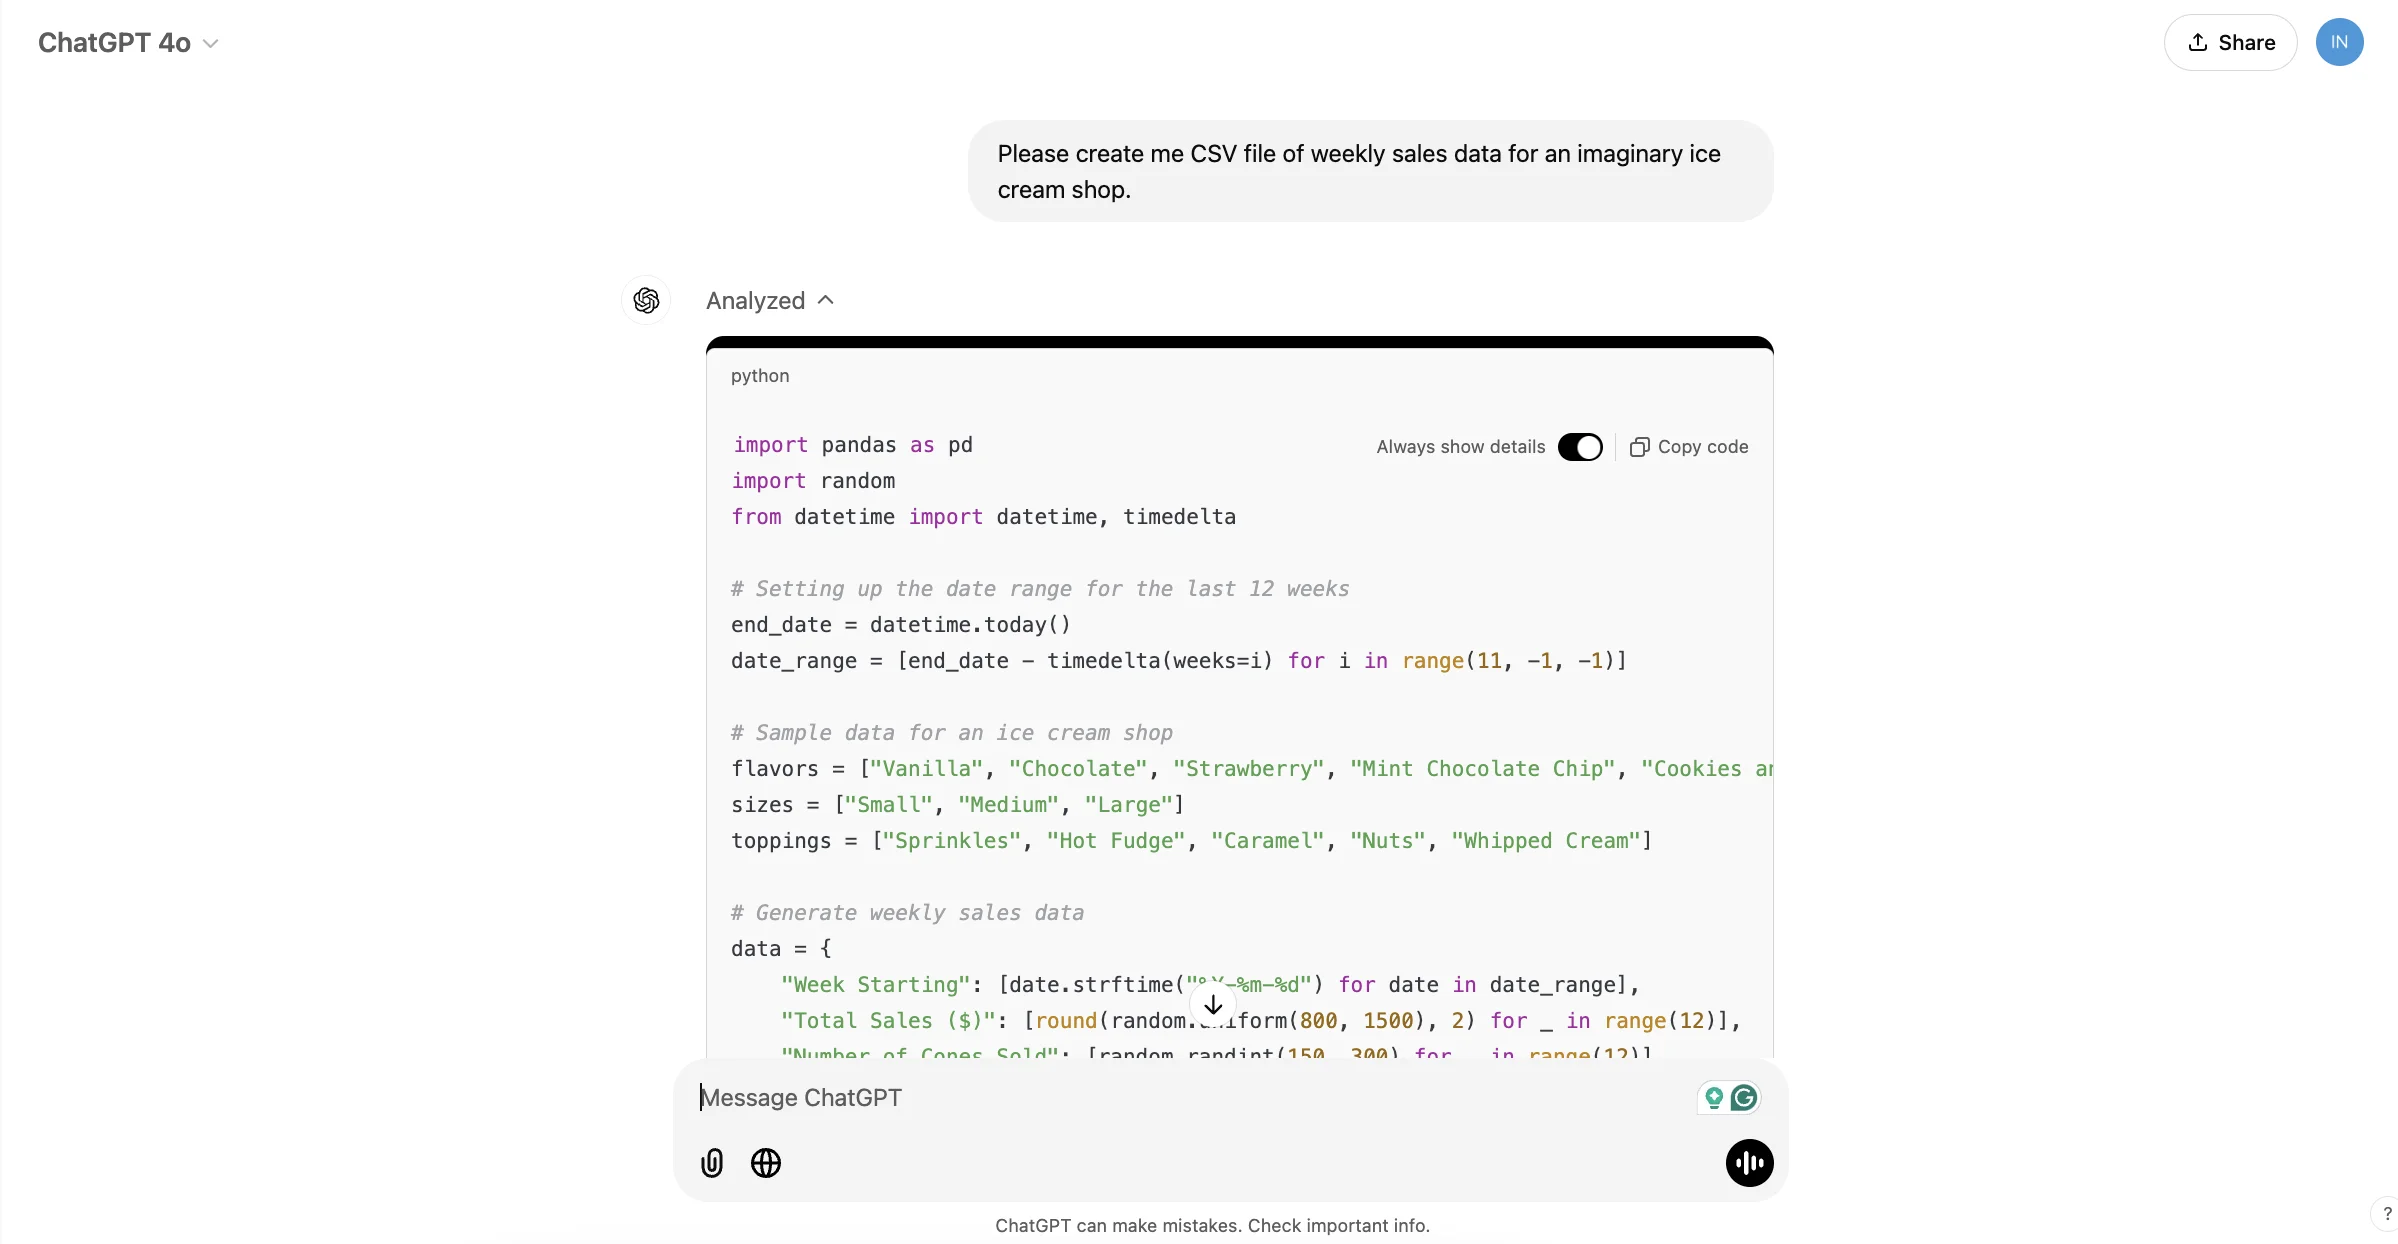
Immediately, ChatGPT will use a Python script to generate data for the CSV file we want.
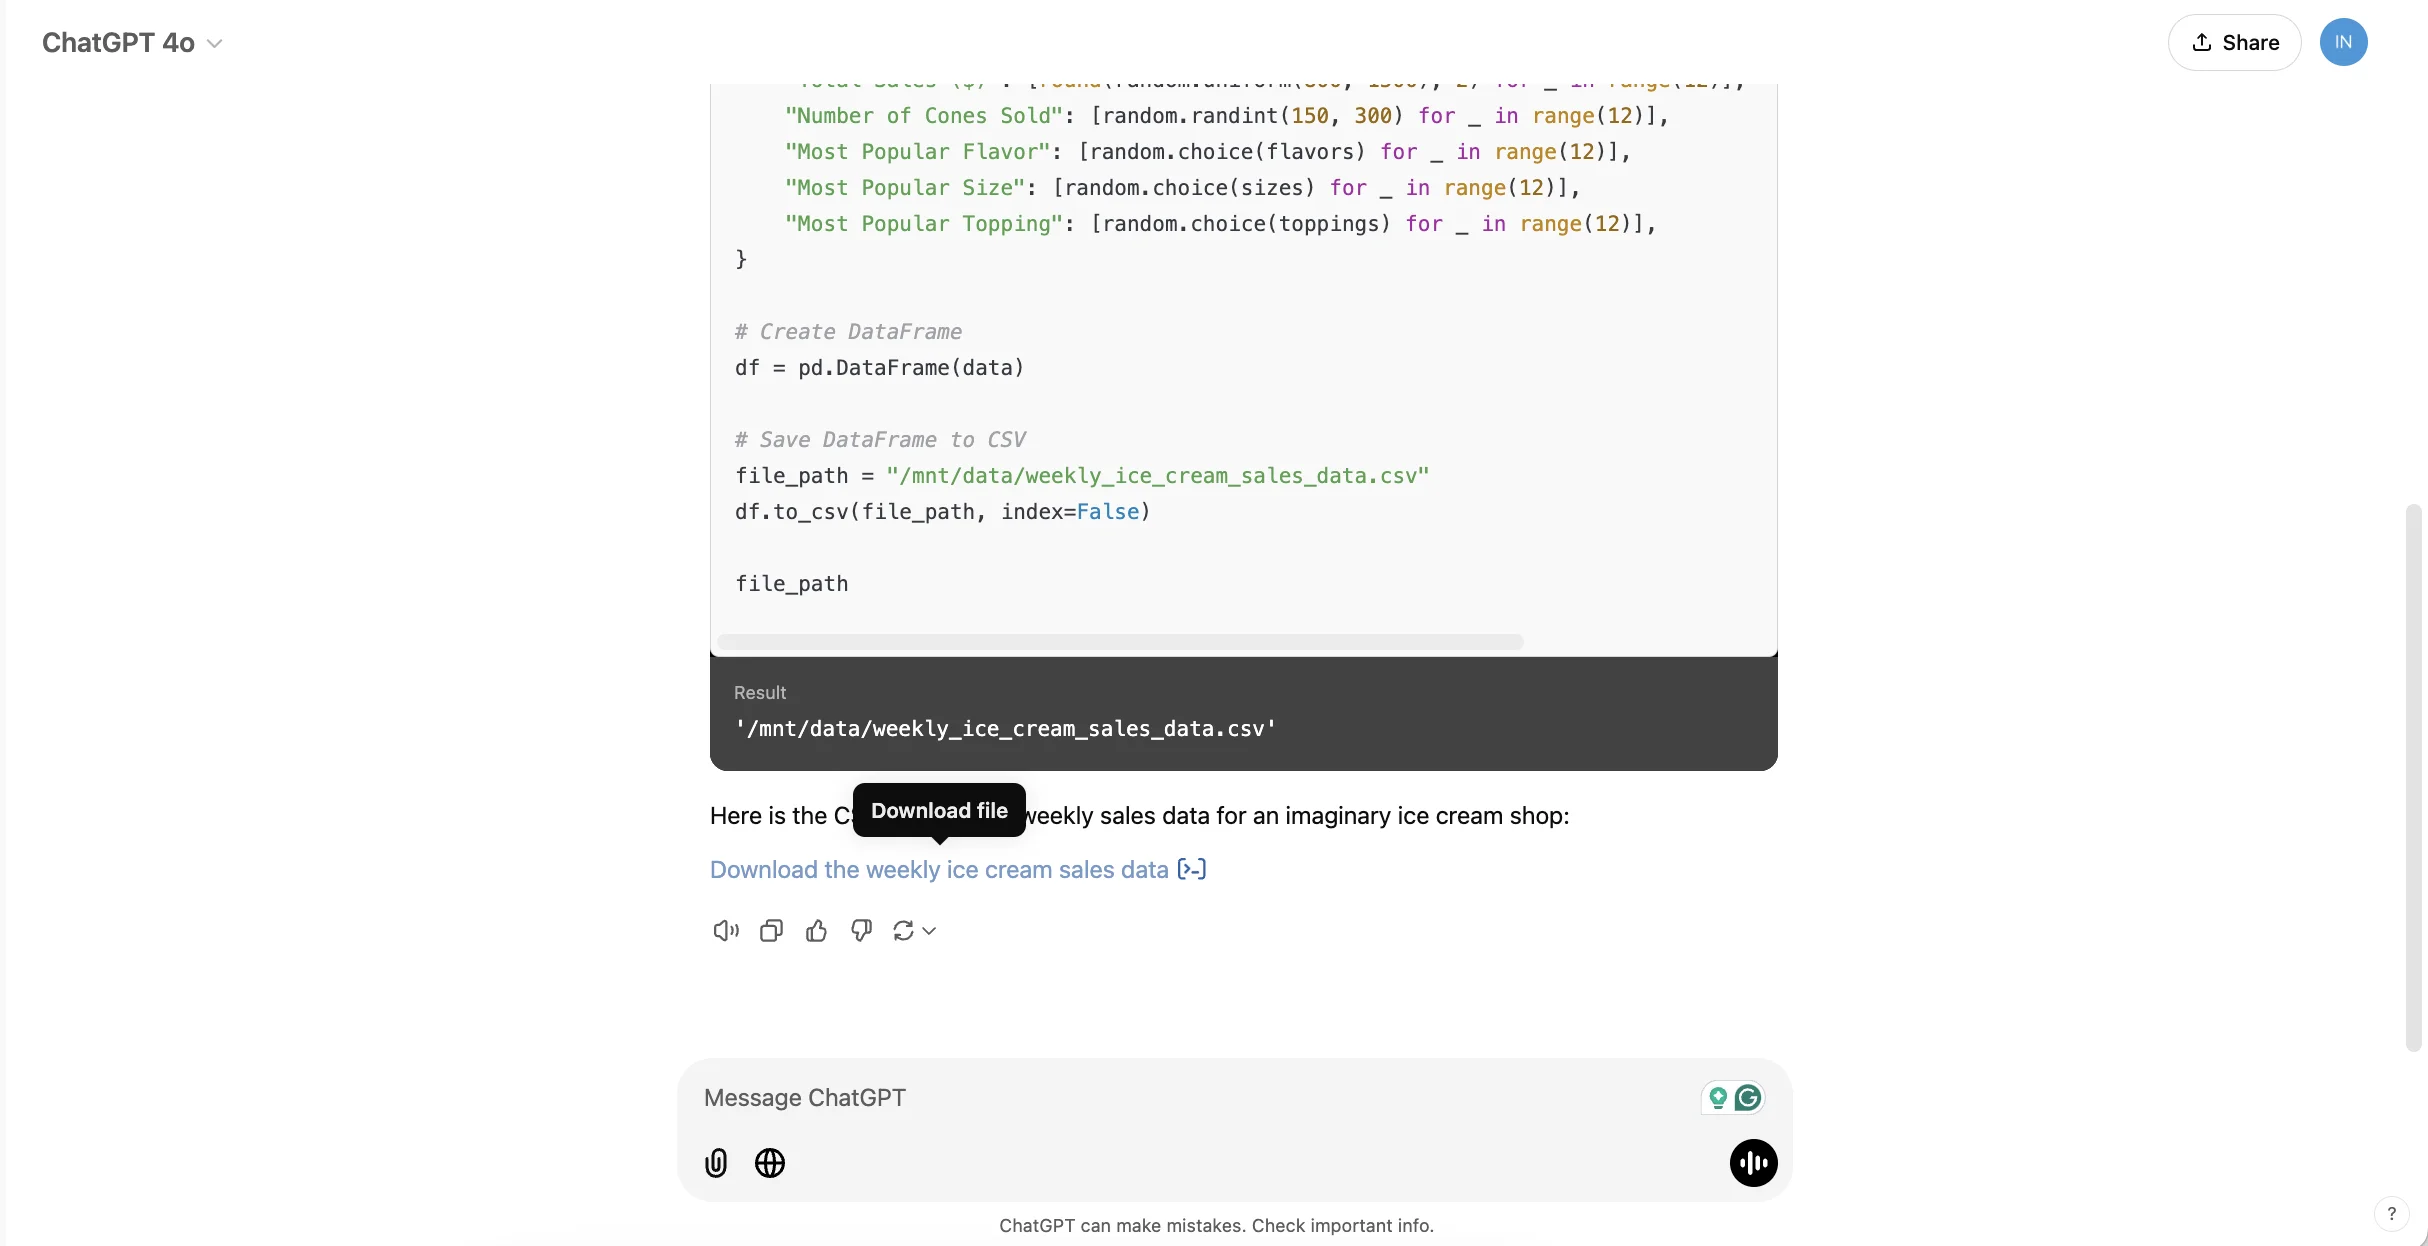
Then, when the CSV file is ready, ChatGPT will give a link to download it.
Likewise, if you have business data in some other format - in a PDF, Google Doc, or Powerpoint presentation, for example - or across multiple files, you can ask ChatGPT to turn that into a single CSV file for use with Claude.
Step 2: Create an analysis tool in Claude
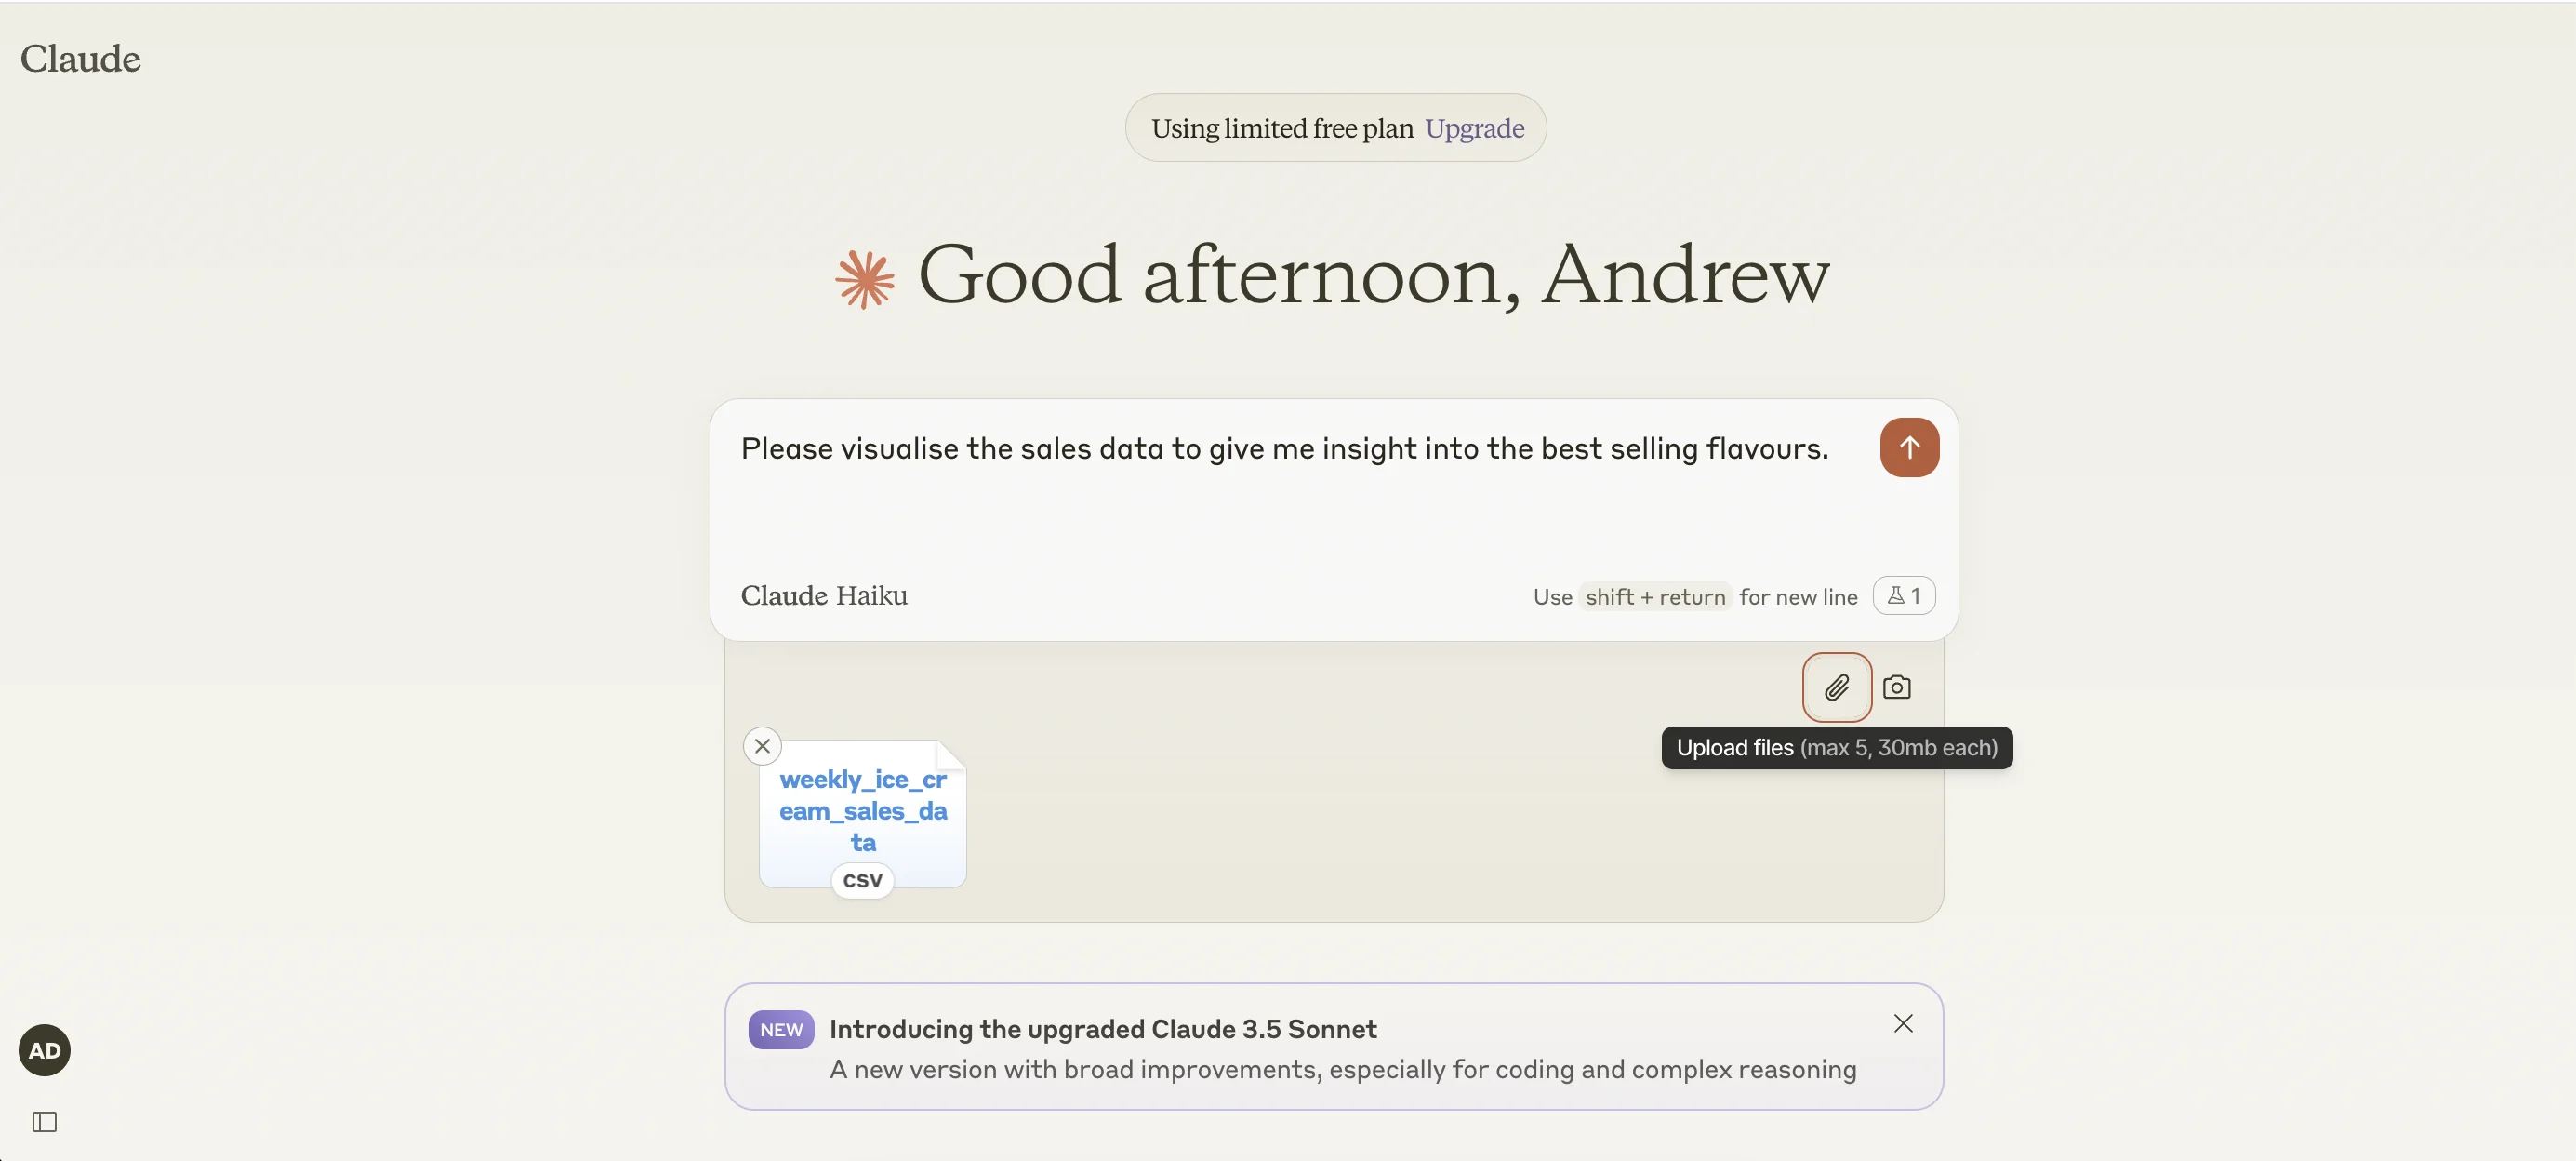
Next, head over to Claude and start a chat with a prompt like this.
Please visualise the sales data to give me insight into the best selling flavours.
Then use the paper clip icon in the bottom right to attach the CSV file generated by ChatGPT (or your own business data).
Claude will immediately get to work - first writing code for the visualisation.
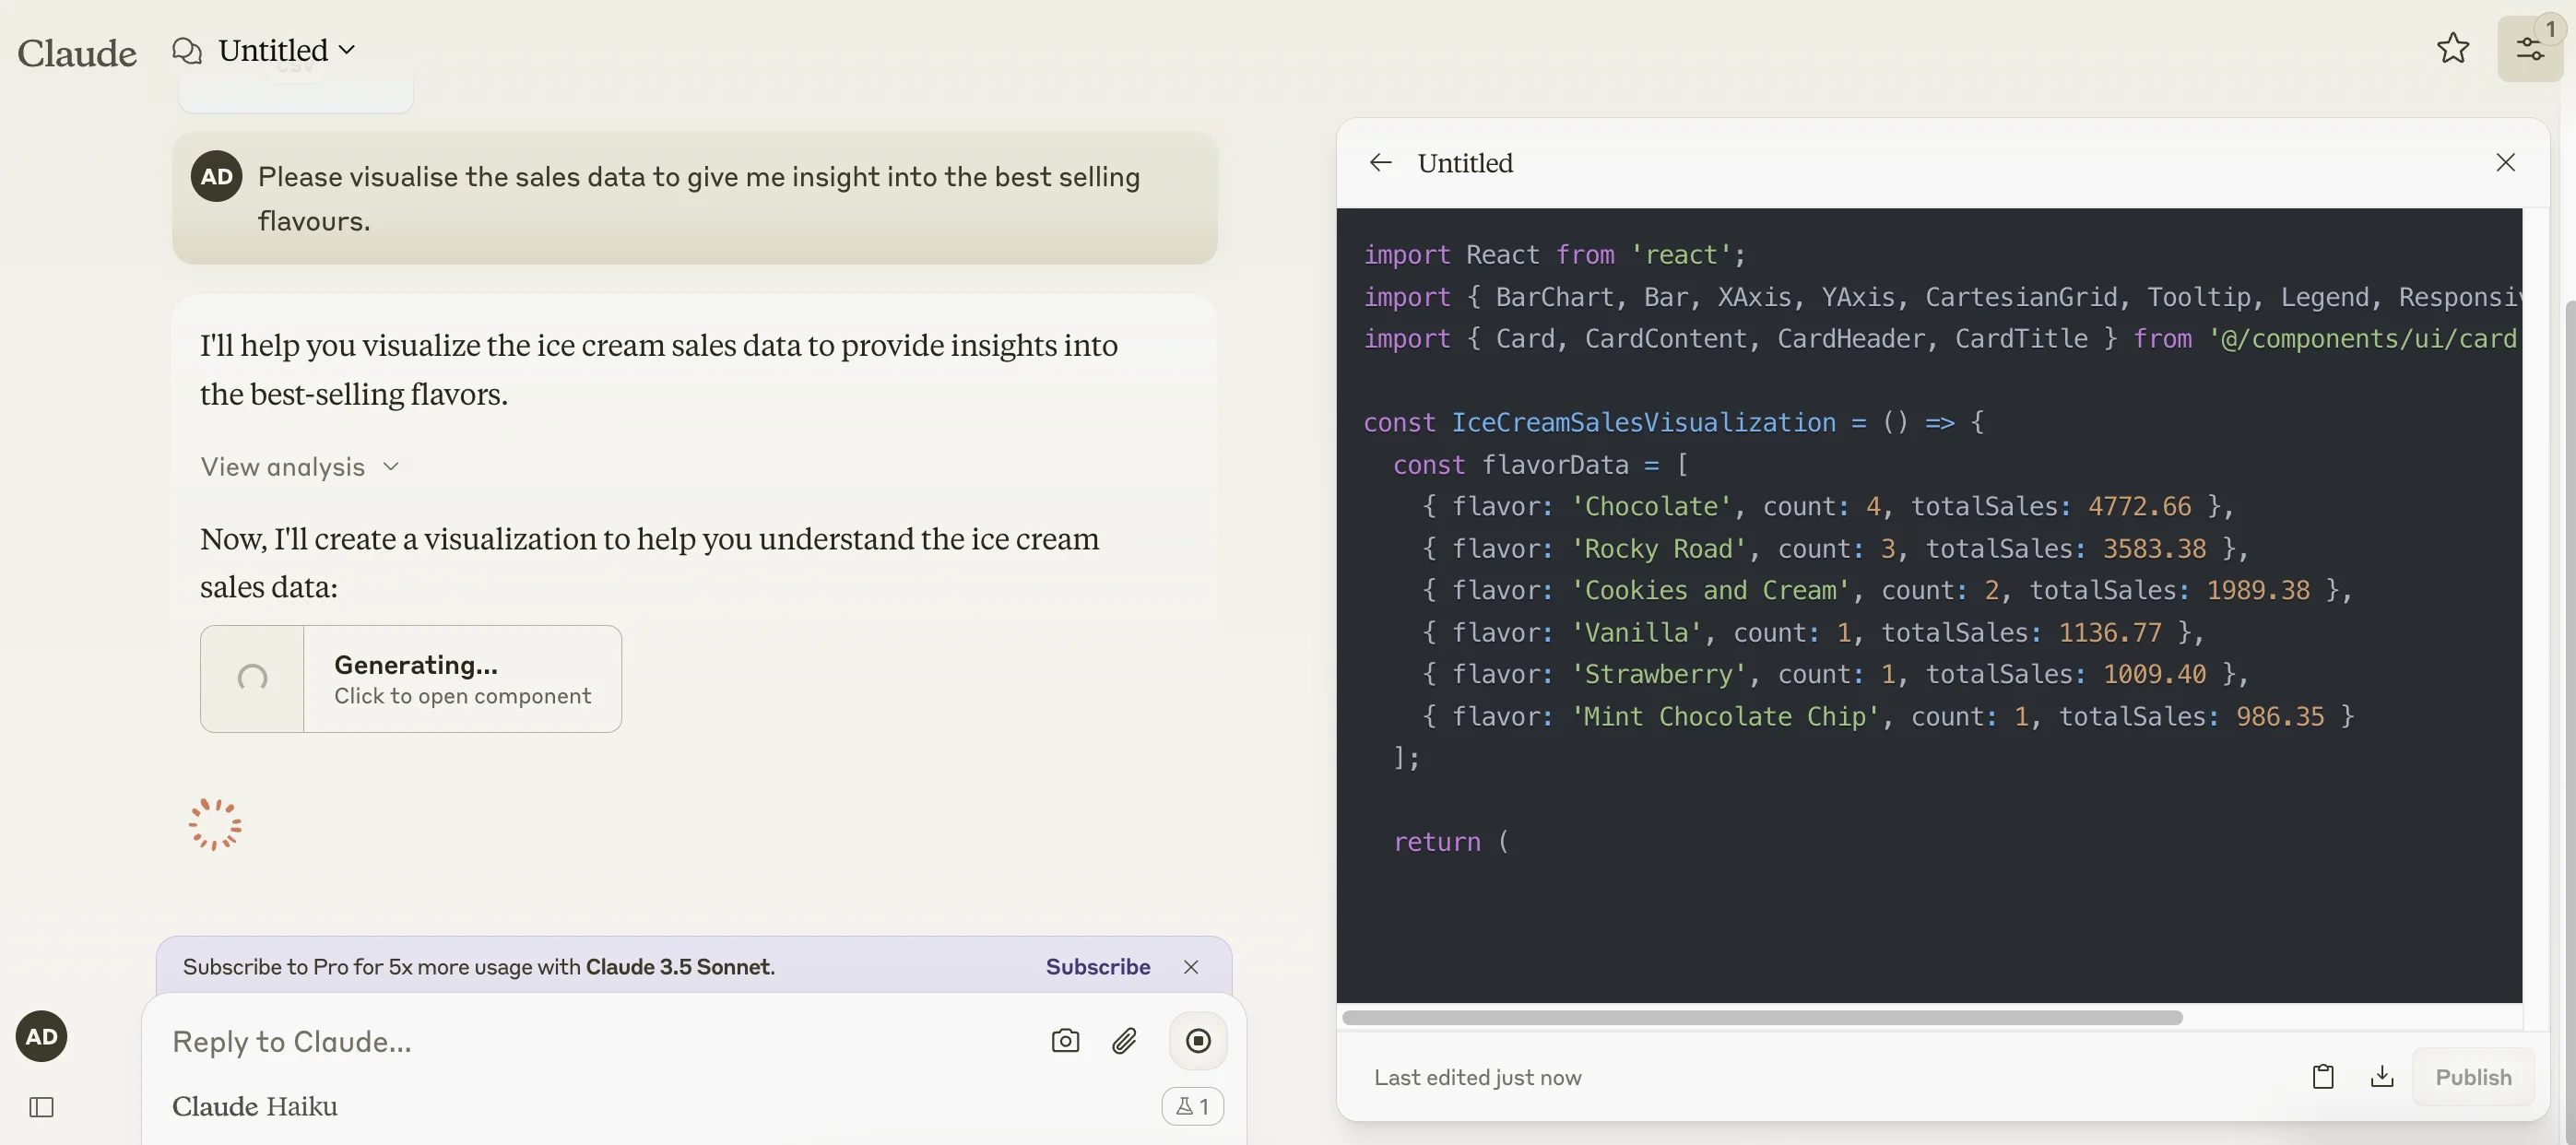
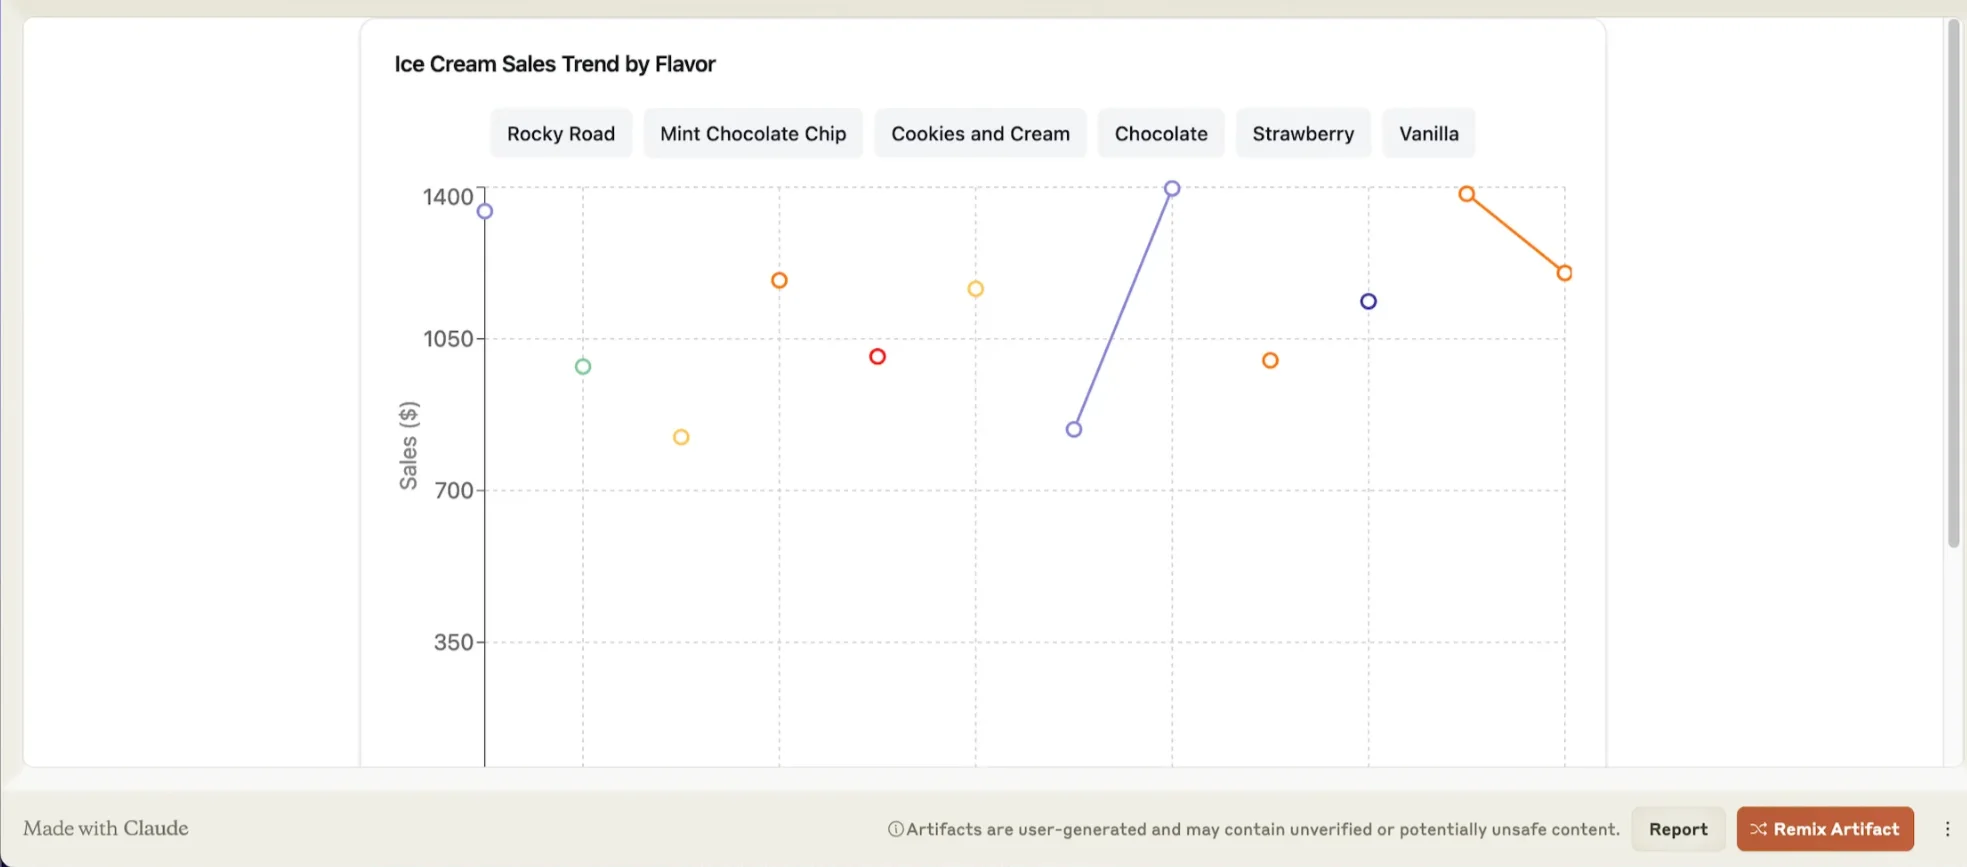
Once the code is written, Claude will instantly run the code and our visualisation is ready.
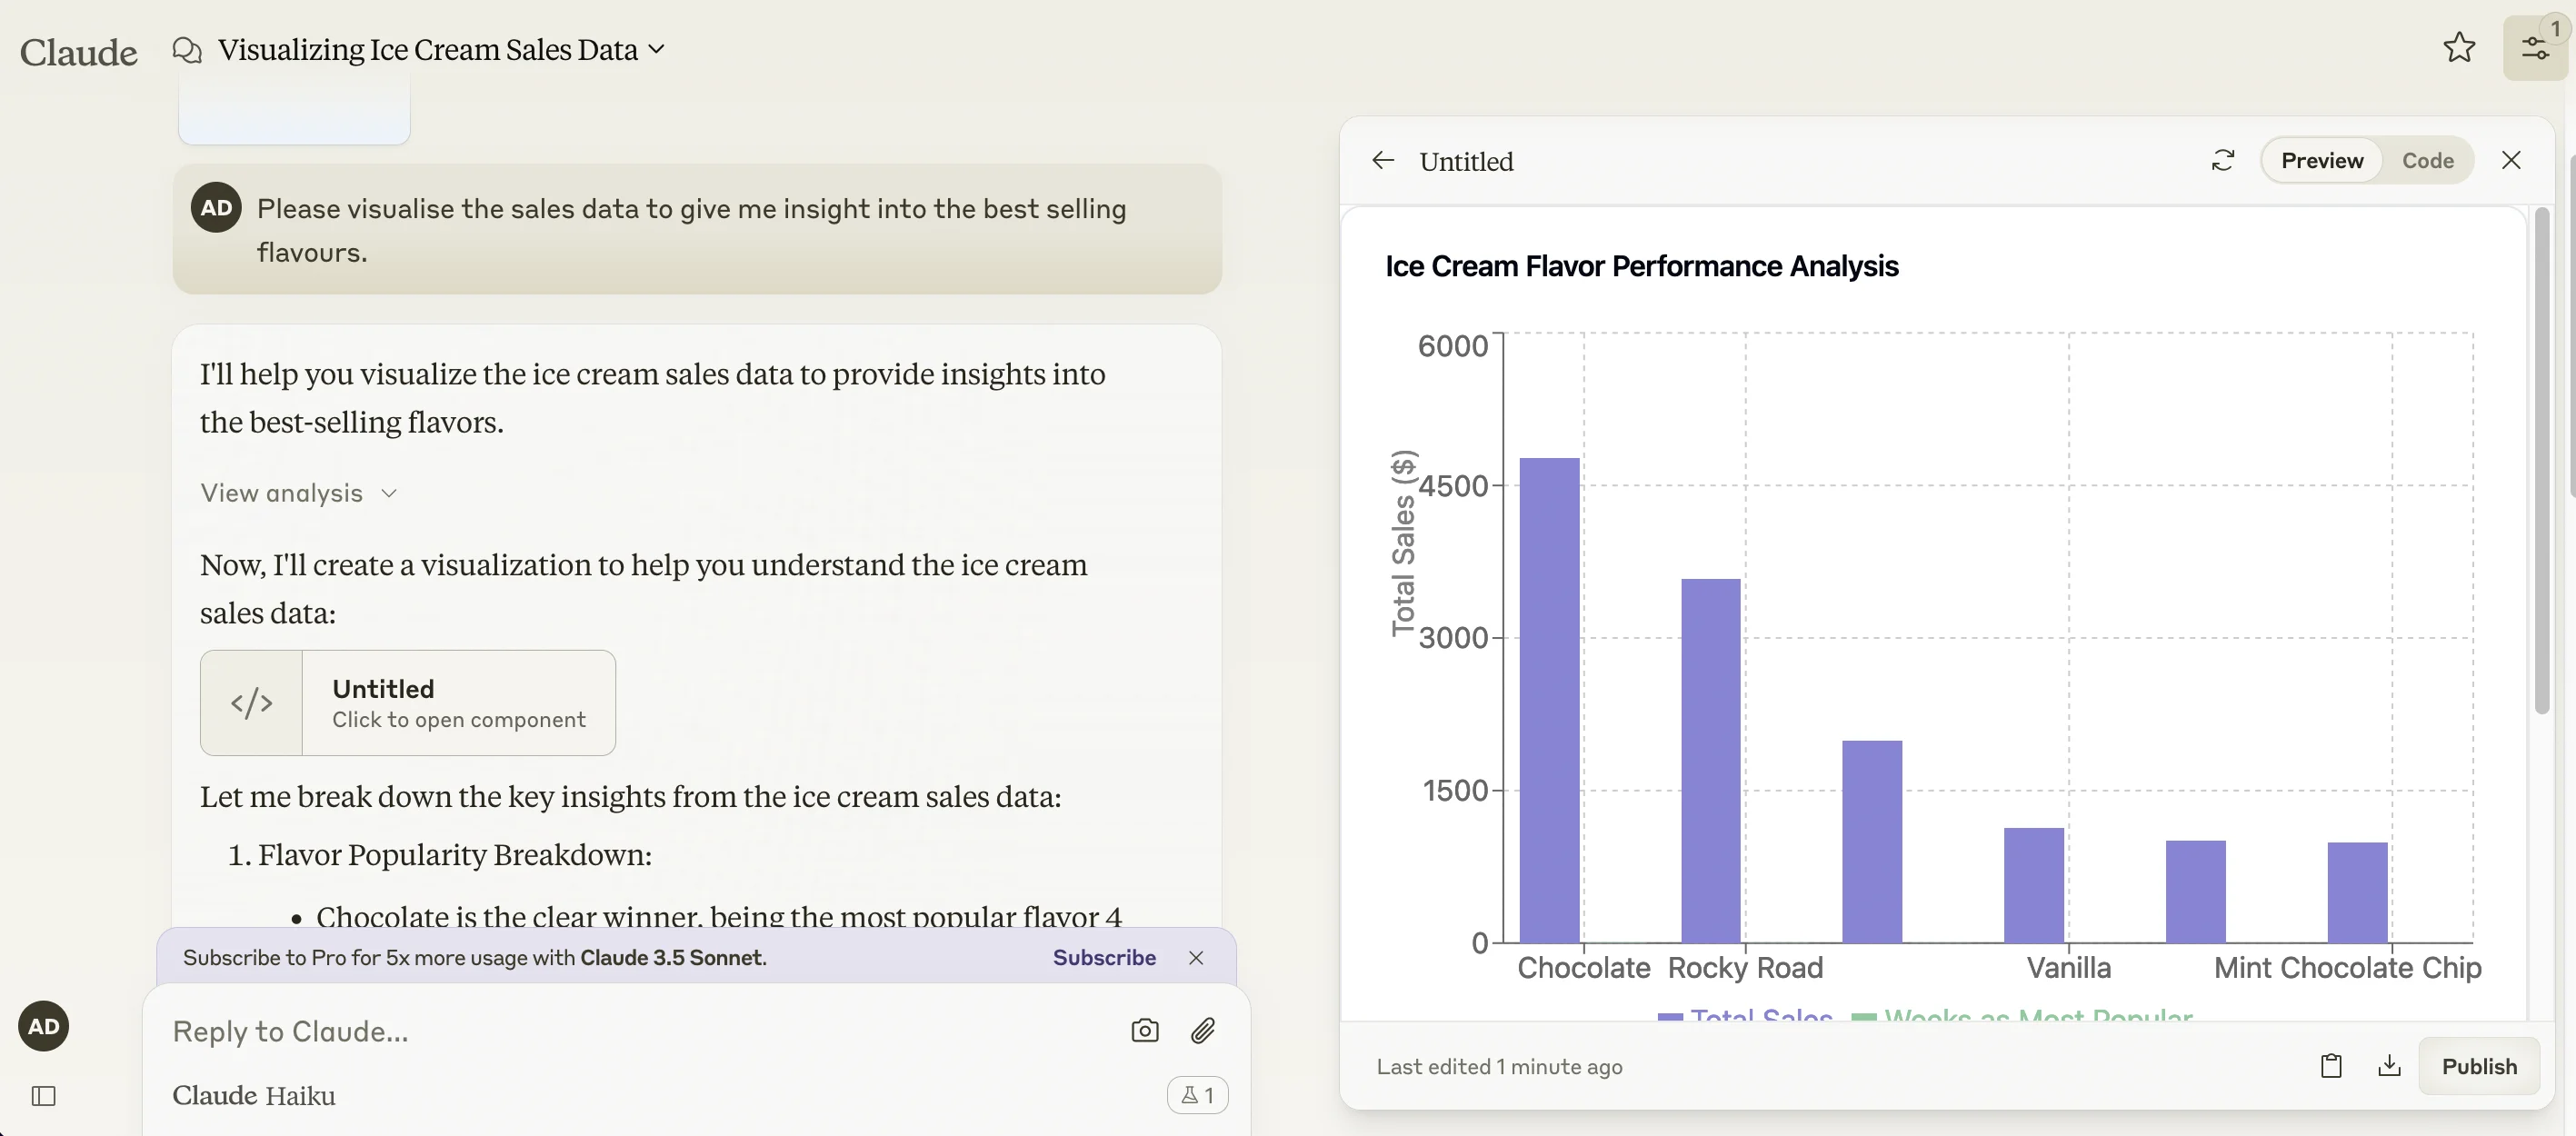
It’s pushed off the screen, but we can clearly see that chocolate and rocky road are our best flavours.
And, as well as a visual analysis, Claude gives us a text summary as well.
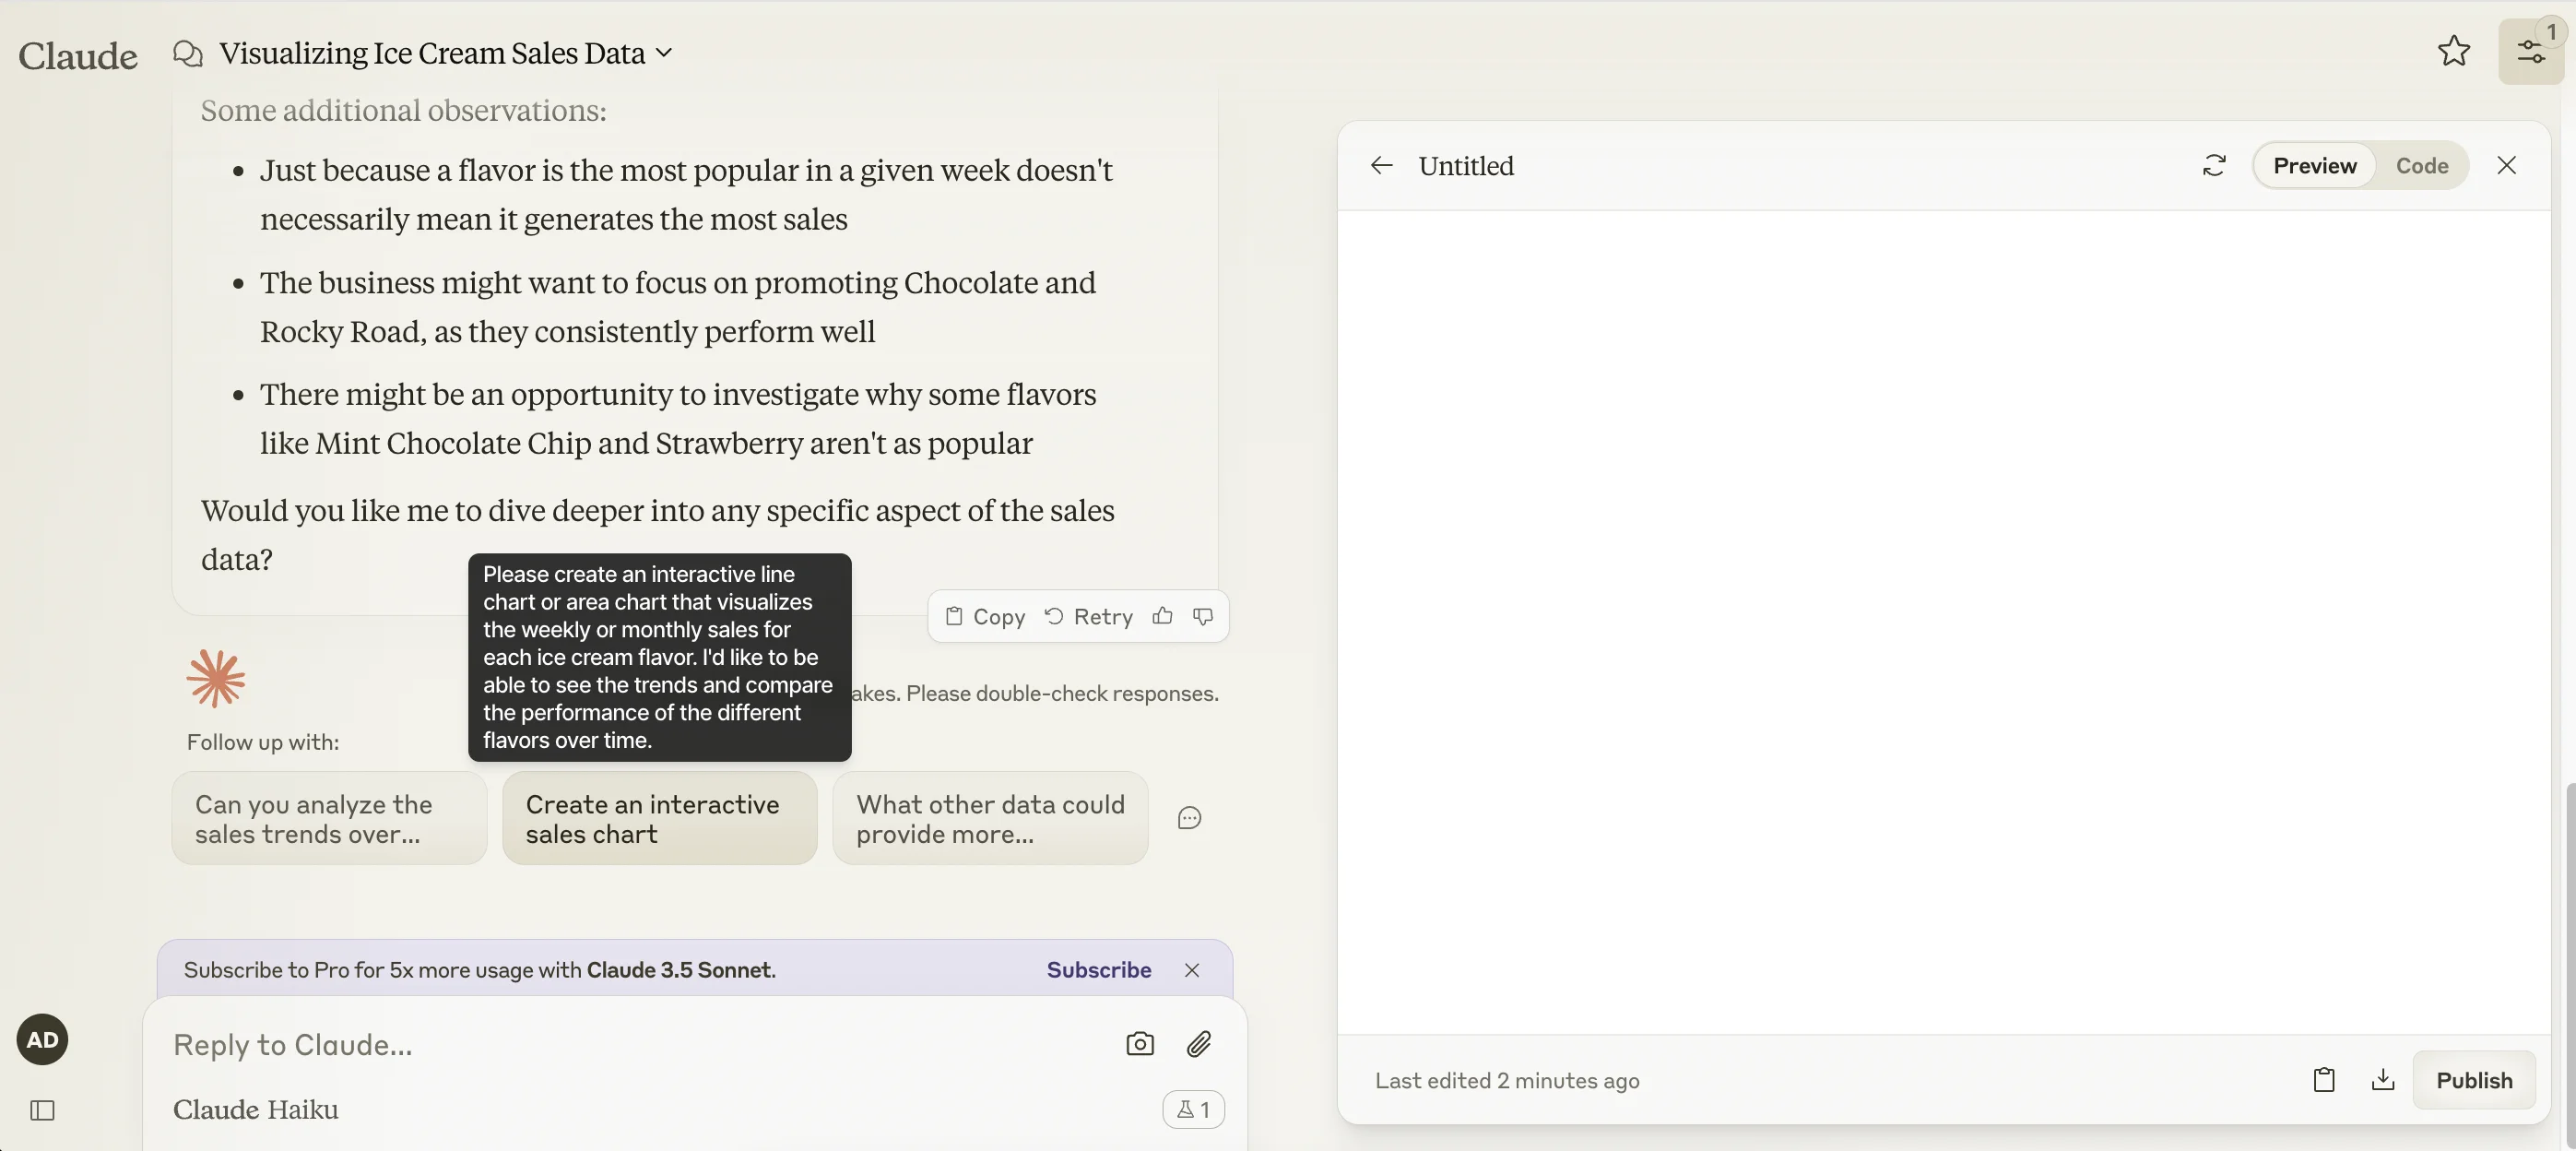
What’s great about Claude’s analysis tool is you can keep asking it to rewrite the code to visualise the data in a different way - and it’ll even give suggested prompts to help with this.
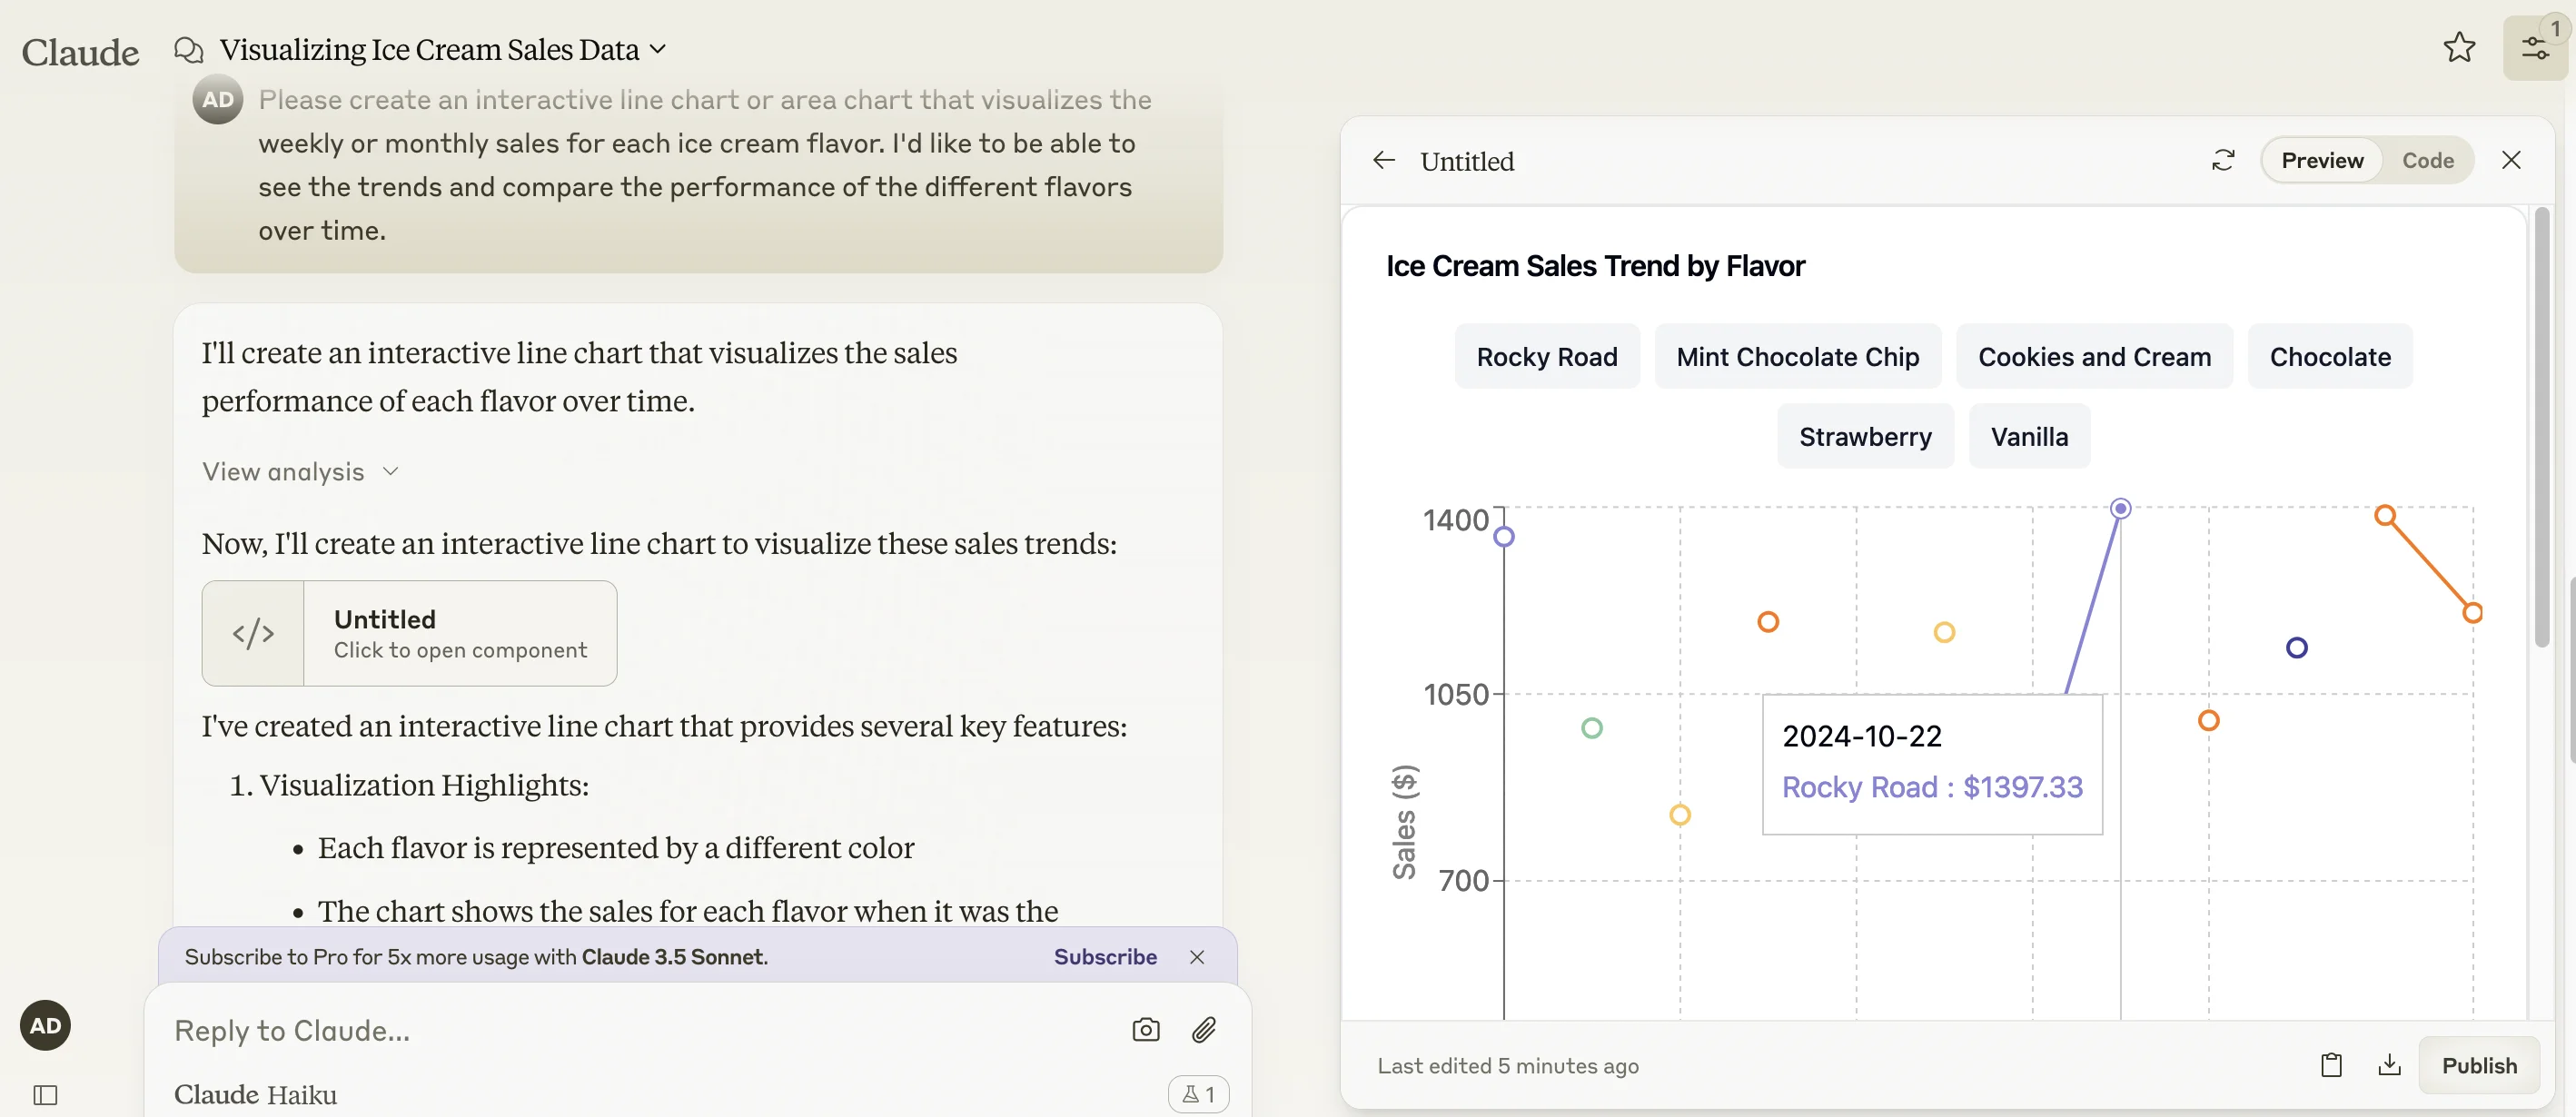
After new code is written and run, we end up with this.
Step 3: Publish your data visualisation for others to view
Another handy feature of Claude is the ability to publish the tools it creates—known as artifacts— for others to access and view.
To do this, click the “Publish” button in the bottom right.
Then, on the next screen, click “Publish & Copy Link”.
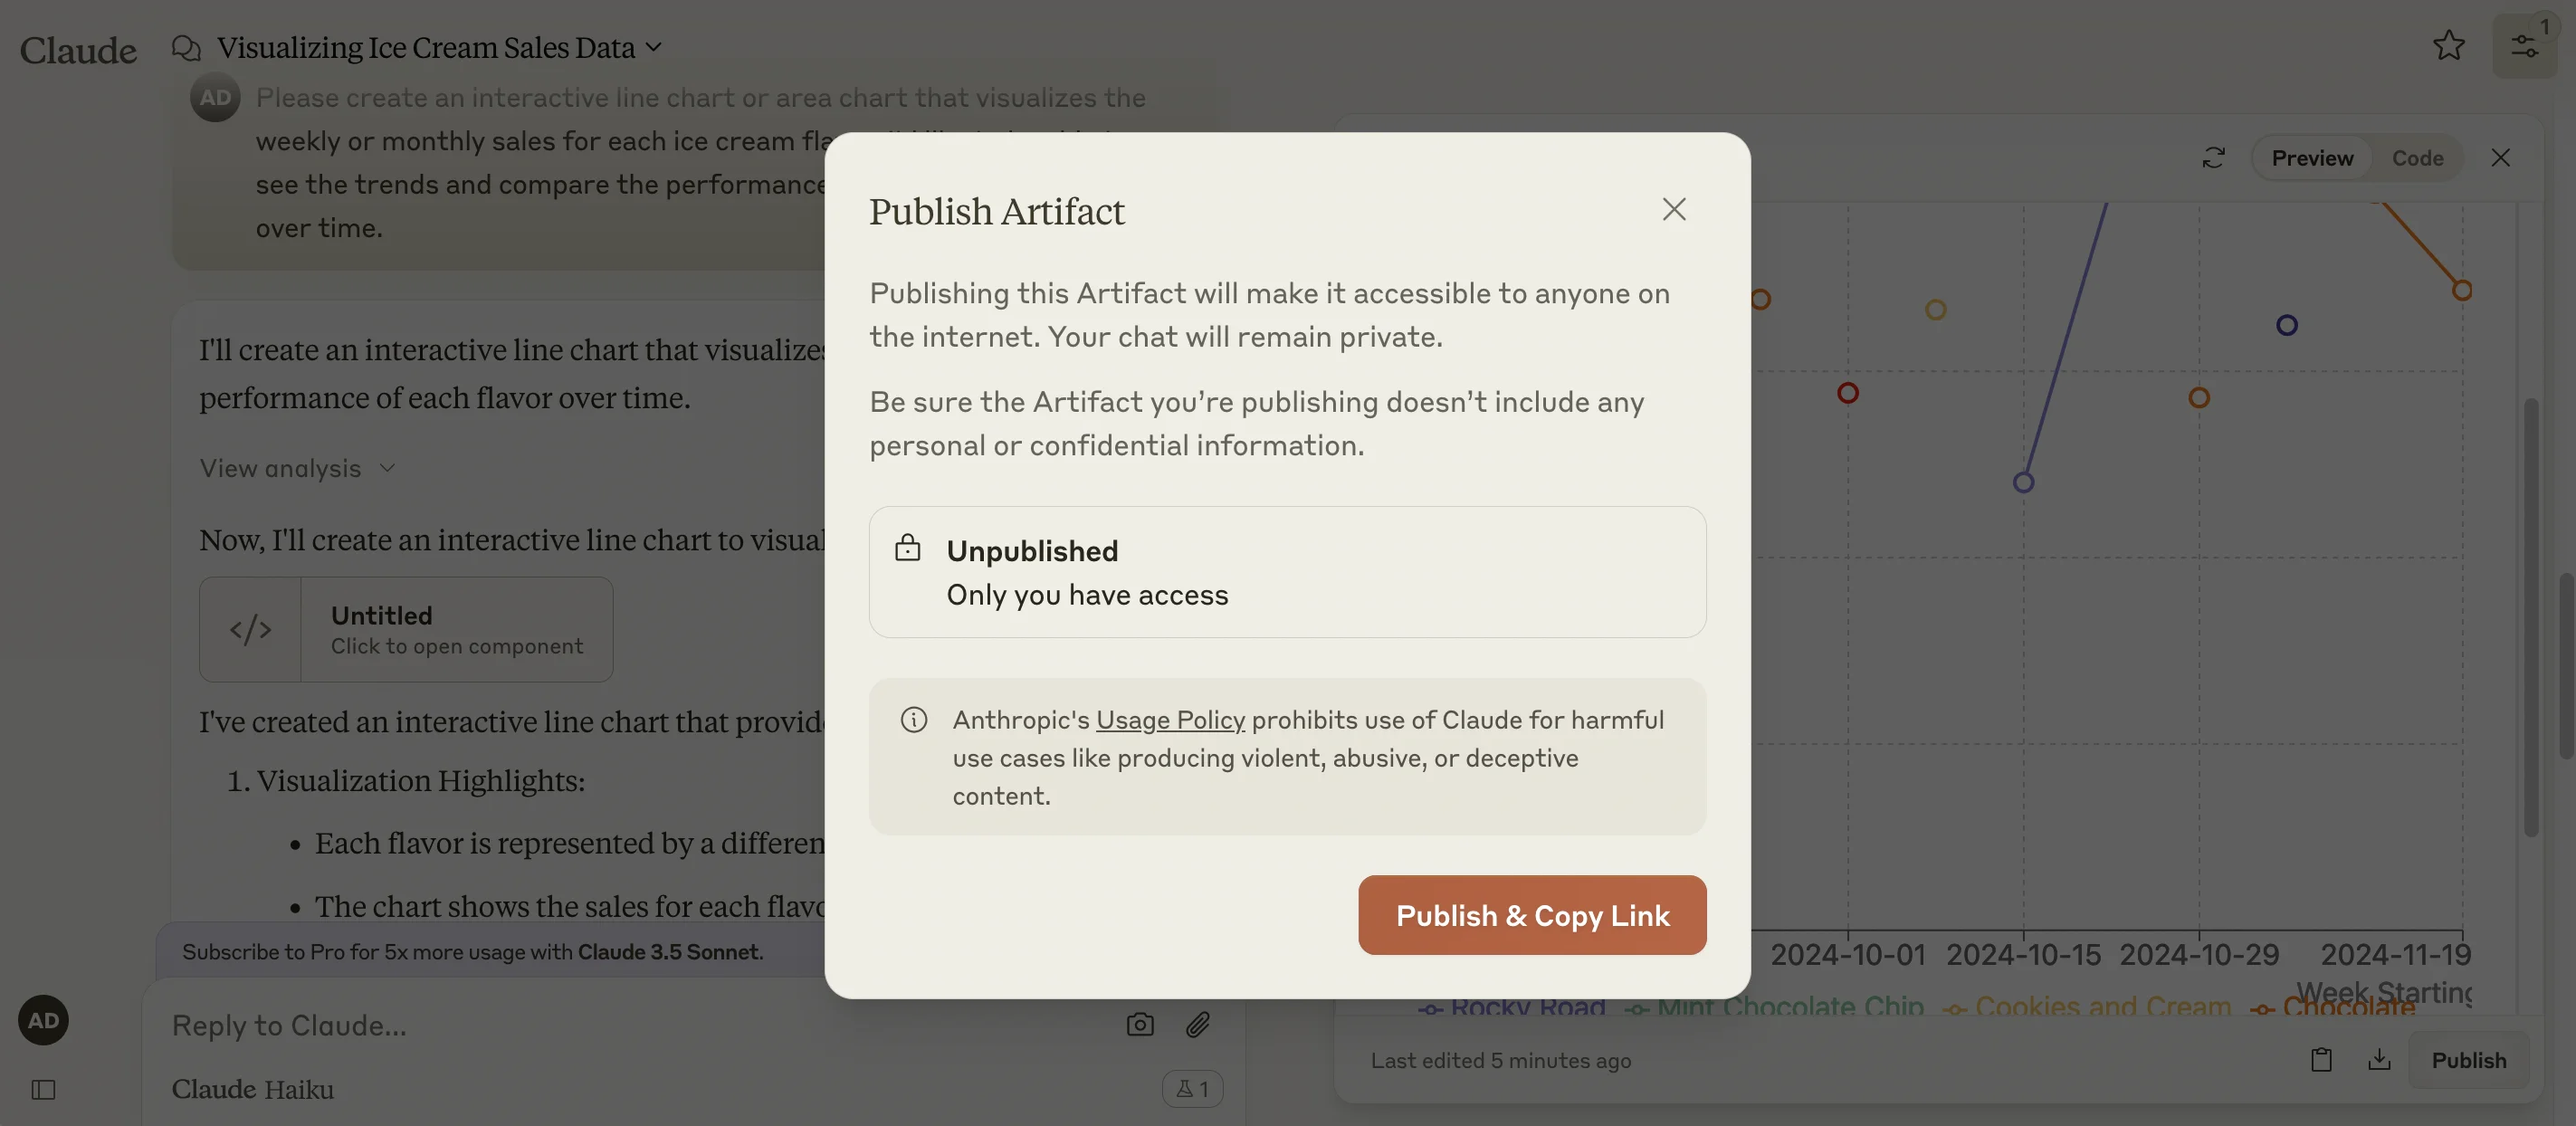
Once live, you’ll be given a URL for your newly published artifact, as well as the ability to unpublish it anytime you want. Click the link and you’ll see the live version of your artifact.
This tutorial was created by Andrew.