Financial modeling with ChatGPT's interactive charts
Create dynamic financial models and forecasts using ChatGPT's data visualization capabilities.
2024-11-13
Financial modeling is a cornerstone of informed business decision-making. By leveraging ChatGPT's advanced capabilities, you can transform raw financial data insightful visualizations with unprecedented ease and efficiency.
This tutorial will guide you through:
- Preparing and organizing financial data for analysis
- Generating interactive financial charts and graphs
- Creating dynamic financial models and projections
- Analyzing various financial scenarios
- Presenting financial insights effectively
Whether you're an entrepreneur seeking to understand your startup's growth trajectory, a financial analyst tasked with forecasting market trends, or an executive making strategic decisions, this guide will equip you with the tools to create sophisticated financial models and explore various scenarios effortlessly.
Step 1: Preparing your financial data
Before creating models and charts, you should make sure your financial data is properly organized and ready for analysis. This step is crucial for accurate results and meaningful insights.
Begin by gathering all relevant financial data for your analysis. This may include:
- Income statements
- Balance sheets
- Cash flow statements
- Sales data
- Expense reports
- Market research data
- Economic indicators
Once you have your data ready, you can ask ChatGPT to help you organize and prepare it for analysis:
I have attached my company's financial data, including income statements, balance sheets, and cash flow statements for the past 5 years. Please analyze this data, organize it in a format suitable for financial modeling, and calculate key financial ratios. Additionally, update the CSV files accordingly.
.webp)
.webp)
ChatGPT will analyze your data and provide a structured overview of your financial information. It may identify trends and calculate key financial ratios.
Step 2: Generating interactive financial charts
Now that your data is organized, you can use ChatGPT to create visual representations of your financial information. Interactive charts can help identify trends, patterns, and relationships that might not be immediately apparent from raw numbers.
Prompt:
Based on the financial data we've organized, please create the following interactive charts:
1. A line chart showing revenue, expenses, and profit trends over the past 5 years
2. A bar chart comparing the breakdown of expenses for each year
3. A pie chart illustrating the current asset allocation
4. A scatter plot showing the relationship between marketing spend and revenue
For each chart, please explain what insights can be drawn from the visualization.
.webp)
.webp)
ChatGPT will generate these charts and provide explanations for each. Take some time to interact with the charts, zooming in on specific data points or time periods to gain a deeper understanding of your financial picture.
Step 3: Creating dynamic financial models
With your data visualized, now you can move on to creating dynamic financial models. These models will allow you to make projections and analyze different scenarios.
Prompt:
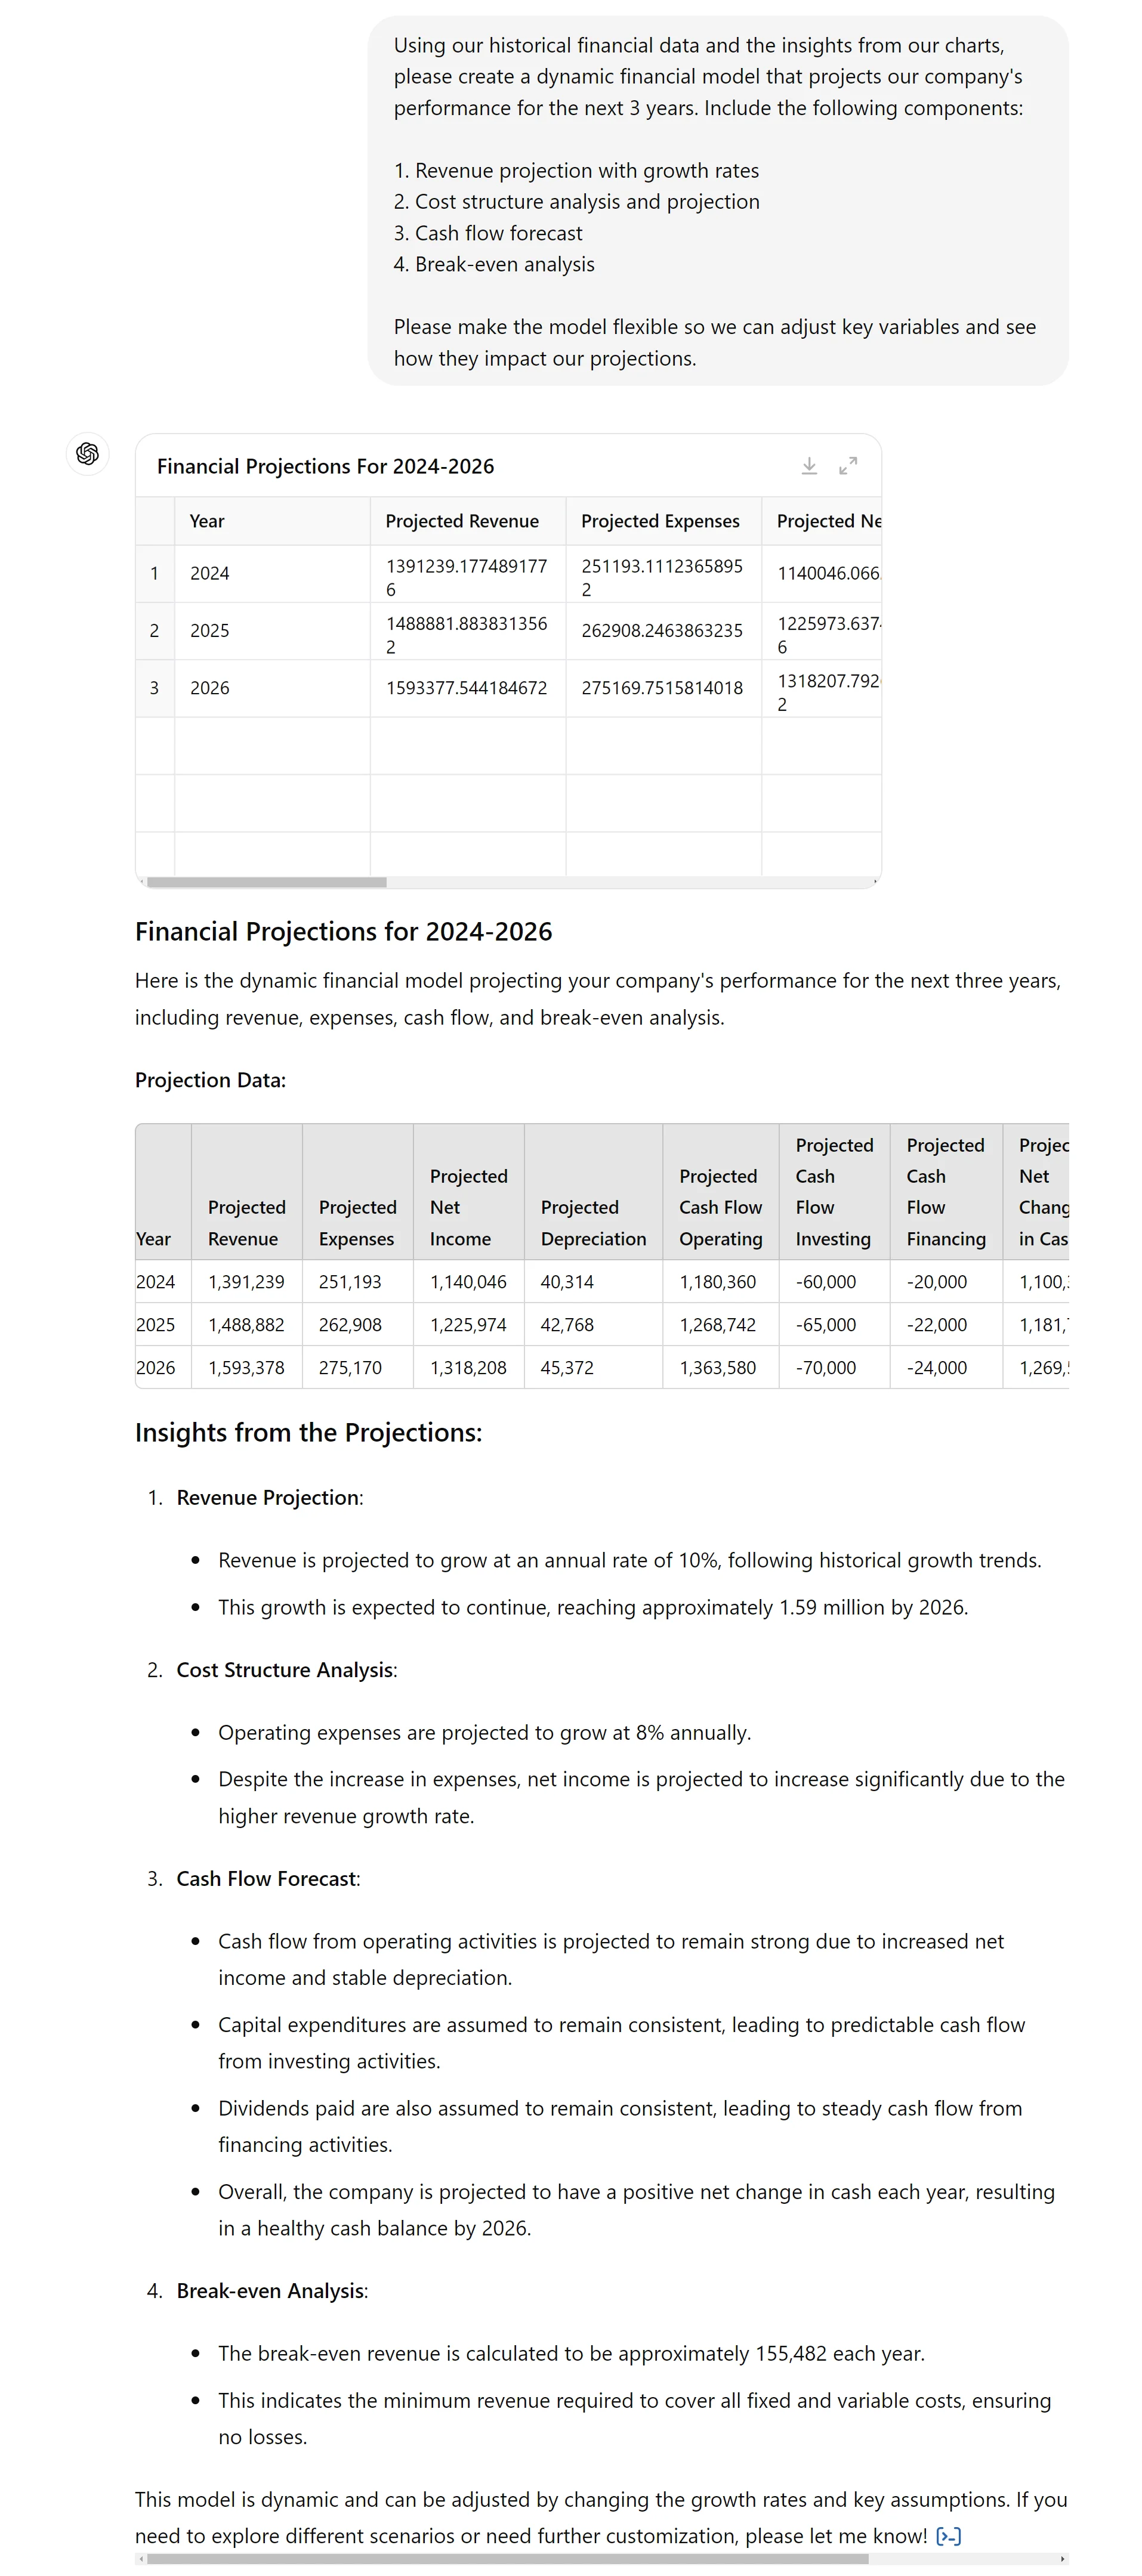
Using our historical financial data and the insights from our charts, please create a dynamic financial model that projects our company's performance for the next 3 years. Include the following components:
1. Revenue projection with growth rates
2. Cost structure analysis and projection
3. Cash flow forecast
4. Break-even analysis
Please make the model flexible so we can adjust key variables and see how they impact our projections.
ChatGPT will create a comprehensive financial model based on your historical data and the insights gained from the previous steps. This model will serve as a powerful tool for forecasting and decision-making.
Step 4: Analyzing financial scenarios
Use your dynamic financial model to analyze various scenarios and make more informed business decisions:
Using our financial model, please analyze the following scenarios:
1. Aggressive growth: Assume we increase our marketing budget by 50% and hire 5 new sales representatives.
2. Cost-cutting: Simulate reducing our operational expenses by 15% across all departments.
3. New product launch: Model the impact of introducing a new product line with an initial investment of $500,000 and projected sales of $1 million in the first year.
For each scenario, please provide updated financial projections and interactive charts showing the potential outcomes. Highlight any risks or opportunities associated with each scenario.
Step 5: Conducting sensitivity analysis
Sensitivity analysis is a crucial step in financial modeling that helps you understand how different variables impact your financial projections, by identifying which factors have the most significant influence on your model's outcomes.
Prompt:
Using our financial model, please conduct a sensitivity analysis on the following key variables:
1. Revenue growth rate
2. Cost of goods sold (COGS) as a percentage of revenue
3. Operating expenses
4. Interest rates on our debt
For each variable, show how a 10% increase and decrease would affect our projected net income and cash flow over the next 3 years. Please present the results in a tornado chart and explain the implications of the analysis.
ChatGPT will perform the sensitivity analysis and generate a tornado chart, which visually represents the impact of each variable on your financial projections. This analysis will help you identify which factors are most critical to your business's financial performance.
Step 6: Presenting financial insights
The final step is to compile all of your analysis, charts, and insights into a clear and compelling presentation. This will help you communicate your financial story effectively to stakeholders, investors, or team members.
Prompt:
Based on our financial analysis, model, and scenario planning, please create a concise executive summary that highlights:
1. Key financial trends over the past 5 years
2. Our projected financial performance for the next 3 years
3. The most promising growth scenario and its potential impact
4. Any significant risks or challenges we should be aware of
5. Top 3 actionable recommendations based on our analysis
Please include relevant charts and visualizations to support each point, and format the summary in a way that's easy to understand for both financial and non-financial audiences.
.webp)
ChatGPT will generate an executive summary that distills all of your financial insights into a clear, actionable format. This summary will serve as a powerful tool for guiding strategic discussions and decision-making.
This tutorial was created by Tanmay.