Measuring impact of your L&D strategy
Learn how AI can help define key metrics, visualize results and present actionable insights.
2024-12-09
Congratulations on reaching the final lesson of our course on Executing a successful L&D strategy using AI.
Throughout this journey, we've covered everything from aligning learning with business goals to creating personalized learning paths and even building AI-powered chatbots. Now, in this last tutorial, we'll tackle a crucial skill for L&D professionals: analyzing and presenting the impact of your learning programs.
In this tutorial, you will learn how to:
- Define L&D-specific KPIs
- Analyze your learning metrics
- Create impactful visualizations
- Generate recommendations and present your findings
Let's get to it.
Step 1: Define key performance indicators (KPIs)
Before we start analyzing data, we need to establish what success looks like for your L&D initiatives. KPIs will be our guiding light, helping us measure what truly matters for your business. Open up Claude and continue the same chat we’ve used in previous tutorials of this course.
Use this prompt to start brainstorming and refining relevant KPIs for our L&D initiatives:
Based on our previous discussions about our business goals and L&D strategy, can you suggest a list of KPIs that would help us measure the effectiveness of our L&D programs? Please categorize these KPIs into learning metrics and business impact metrics, and rank them in order of importance for our specific context.
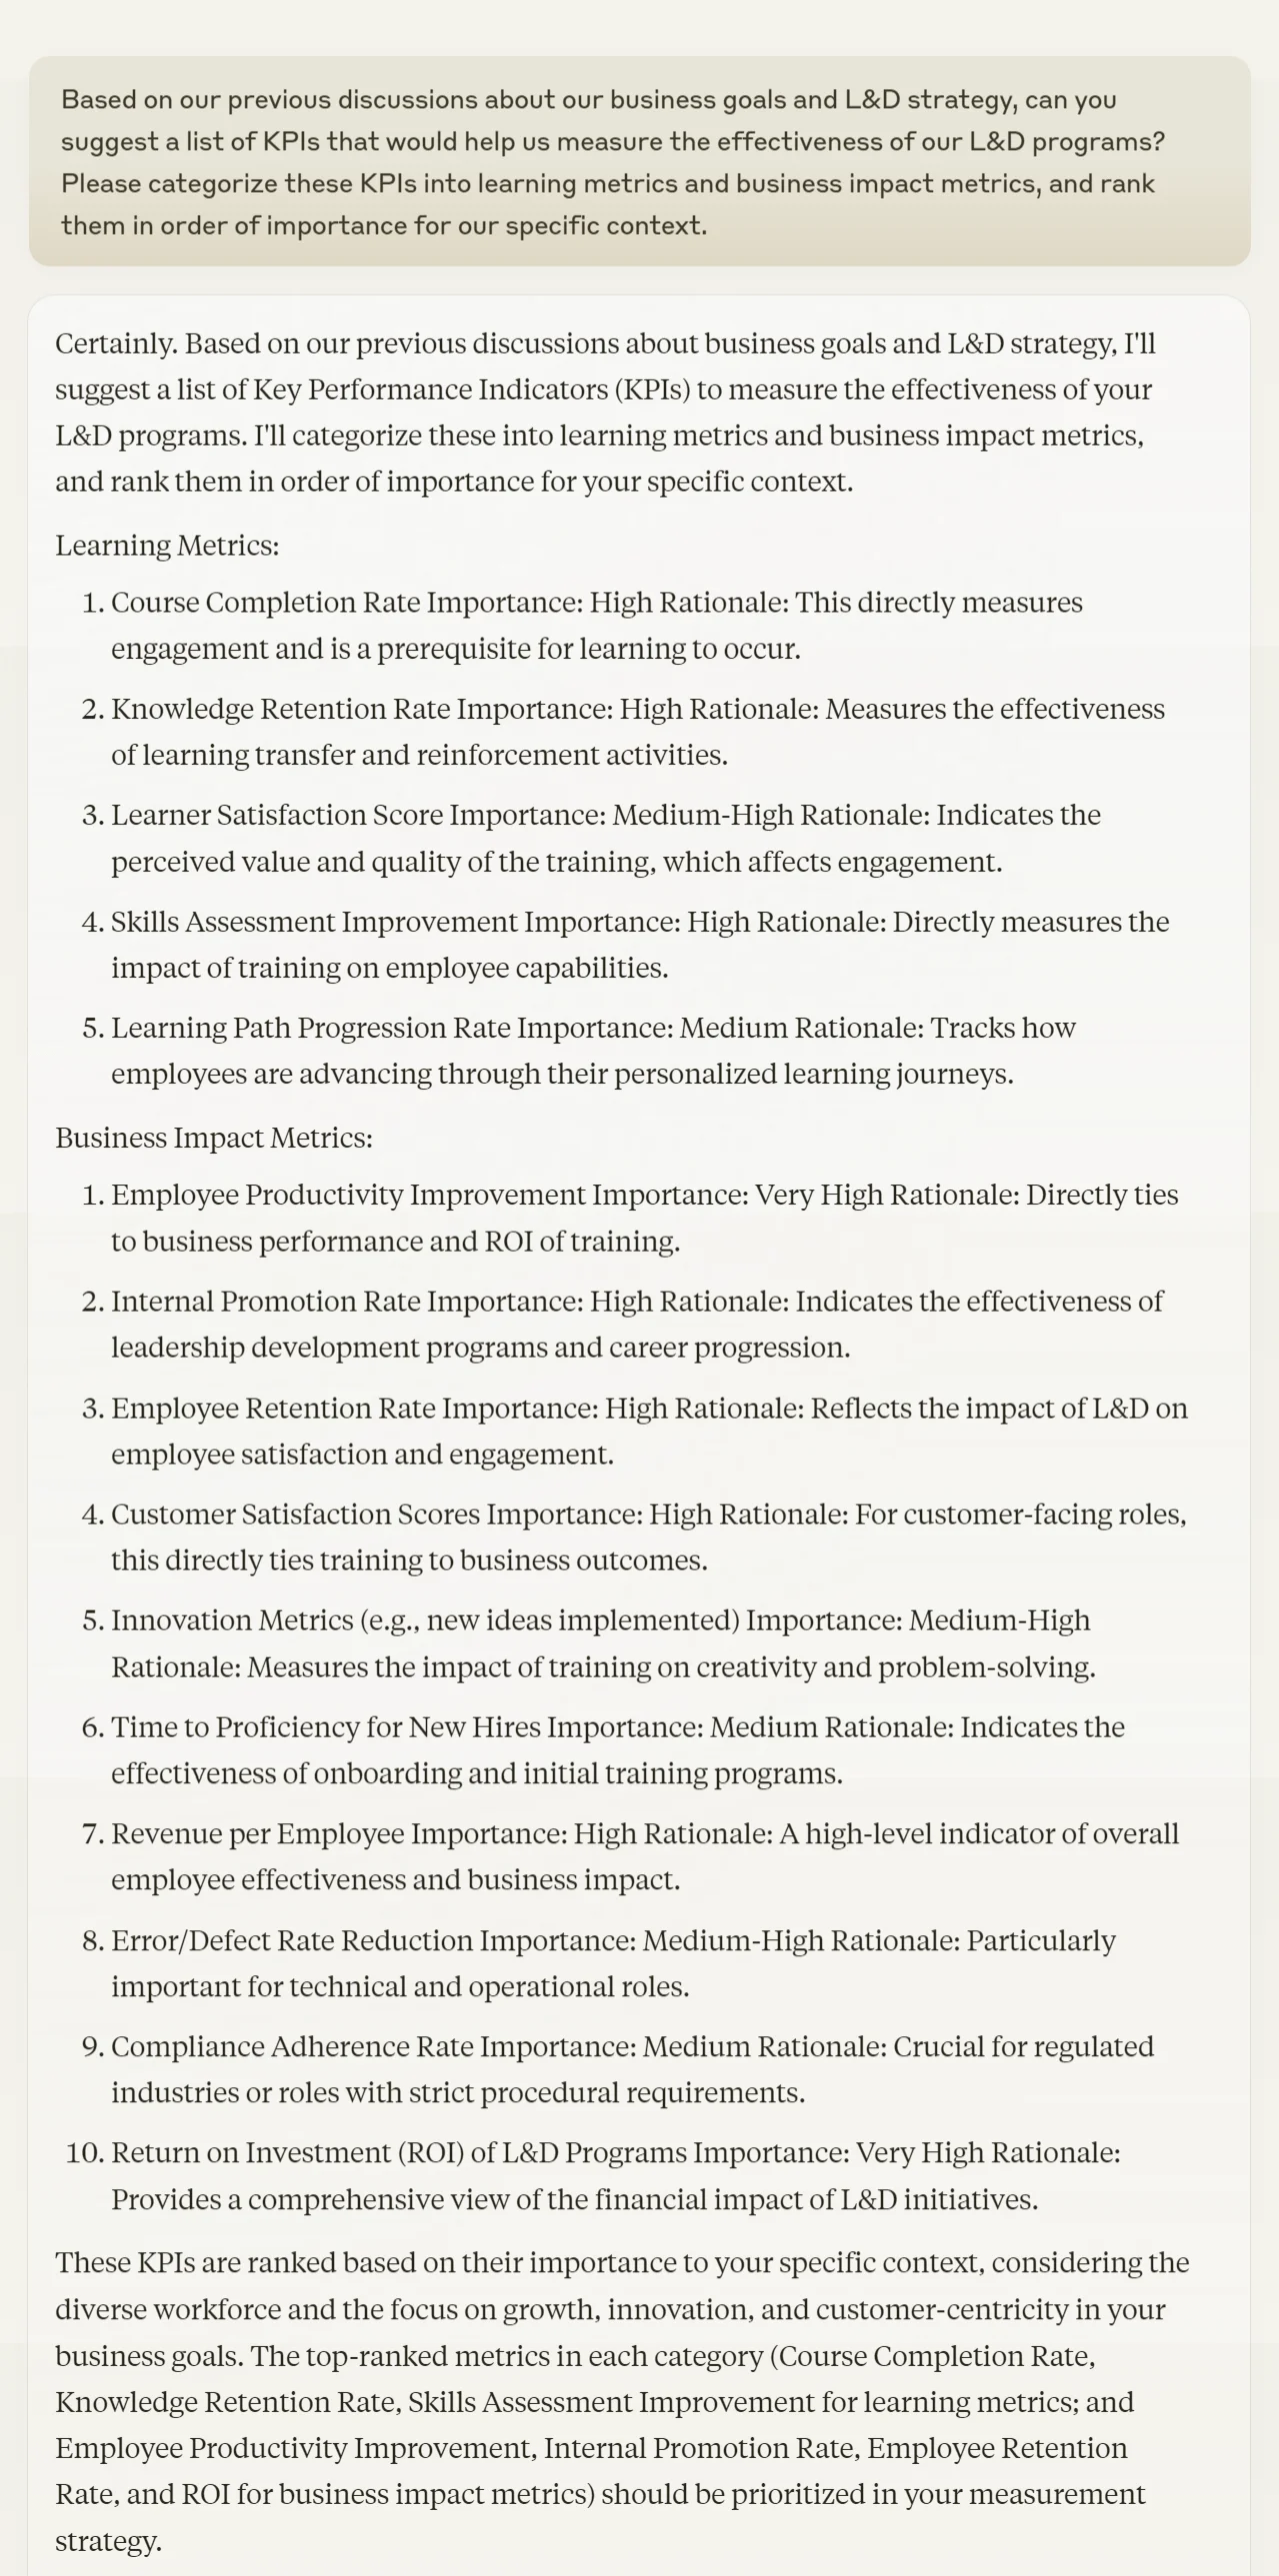
Review the categorized and ranked list of KPIs provided by Claude. Select the top 3-5 KPIs from each category that align best with your organization's goals. Remember, while it's tempting to track everything, focusing on a manageable number of key metrics will lead to more actionable insights.
Step 2: Analyze L&D impact data
Before we begin the analysis, export the analytics and reports data from your LMS system into a CSV file. Most modern LMS platforms offer this functionality, allowing you to download learner data, course completions, assessment scores, and other relevant metrics.
Upload the CSV file in Claude and use this prompt:
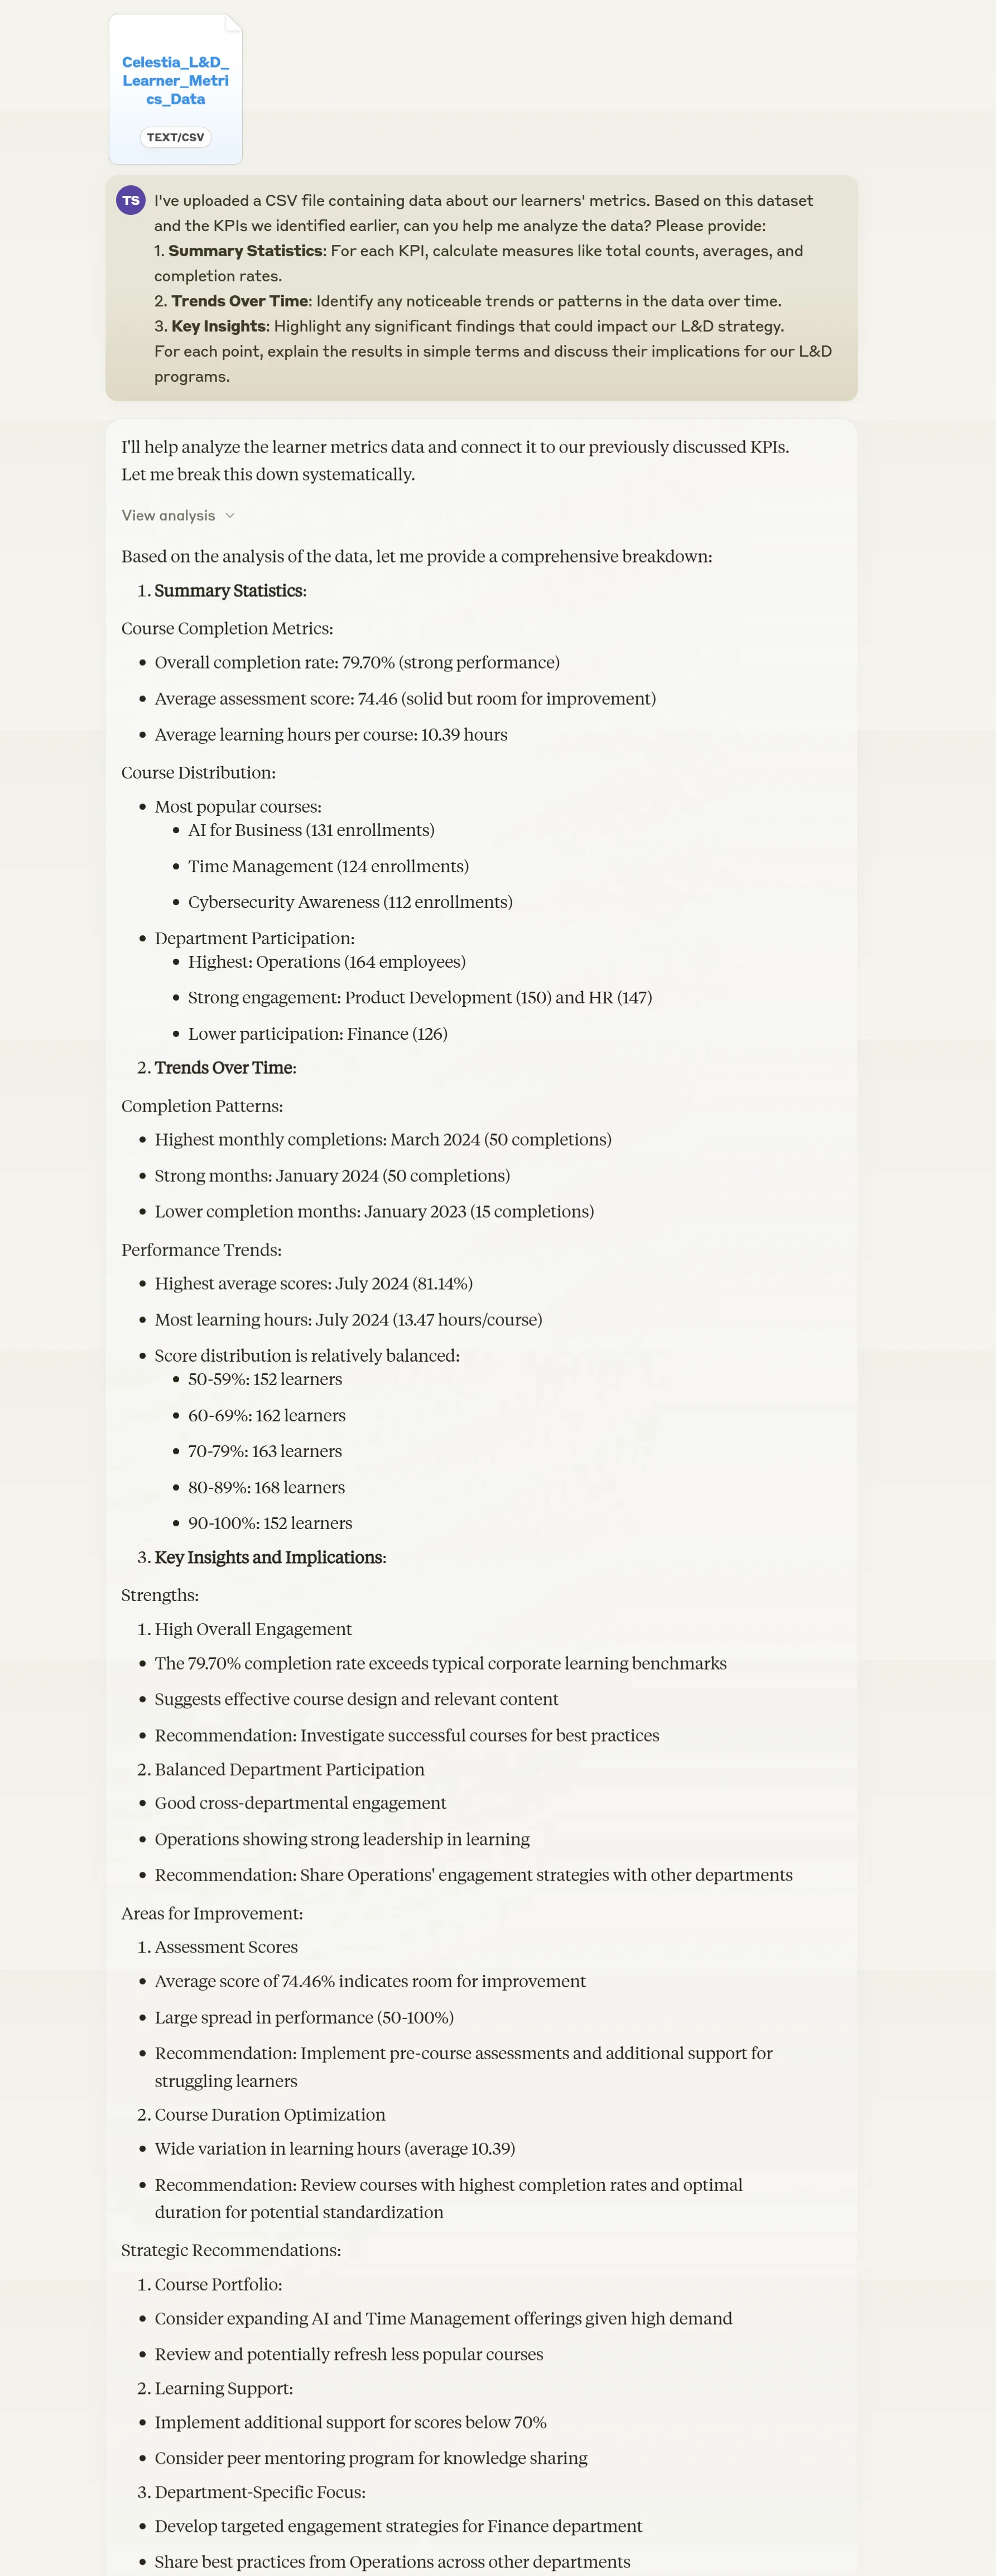
I've uploaded a CSV file containing data about our learners' metrics. Based on this dataset and the KPIs we identified earlier, can you help me analyze the data? Please provide:
1. Summary Statistics: For each KPI, calculate measures like total counts, averages, and completion rates.
2. Trends Over Time: Identify any noticeable trends or patterns in the data over time.
3. Key Insights: Highlight any significant findings that could impact our L&D strategy.
For each point, explain the results in simple terms and discuss their implications for our L&D programs.
Step 3: Visualize L&D impact results
Numbers are powerful, but visualizations can make your data sing. In this step, we'll use Claude to suggest and create impactful visualizations that bring your L&D data to life.
Use the following prompt to get visualization recommendations and create them:
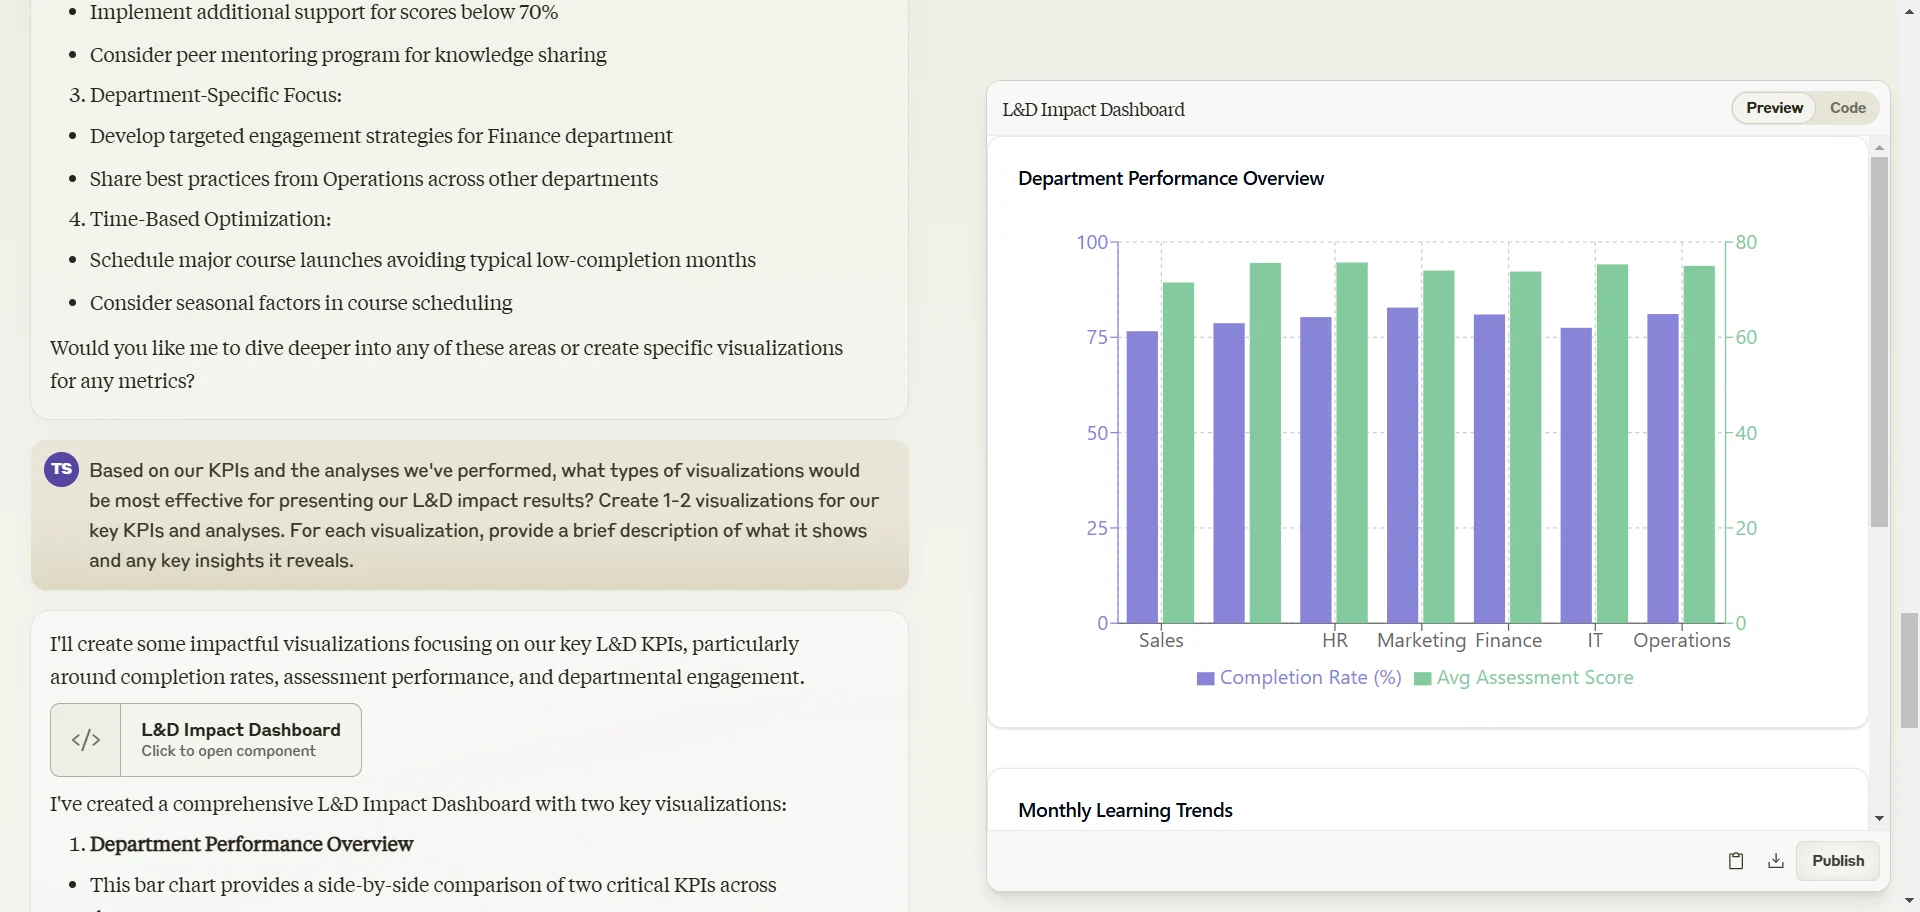
Based on our KPIs and the analyses we've performed, what types of visualizations would be most effective for presenting our L&D impact results? Create 1-2 visualizations for our key KPIs and analyses. For each visualization, provide a brief description of what it shows and any key insights it reveals.
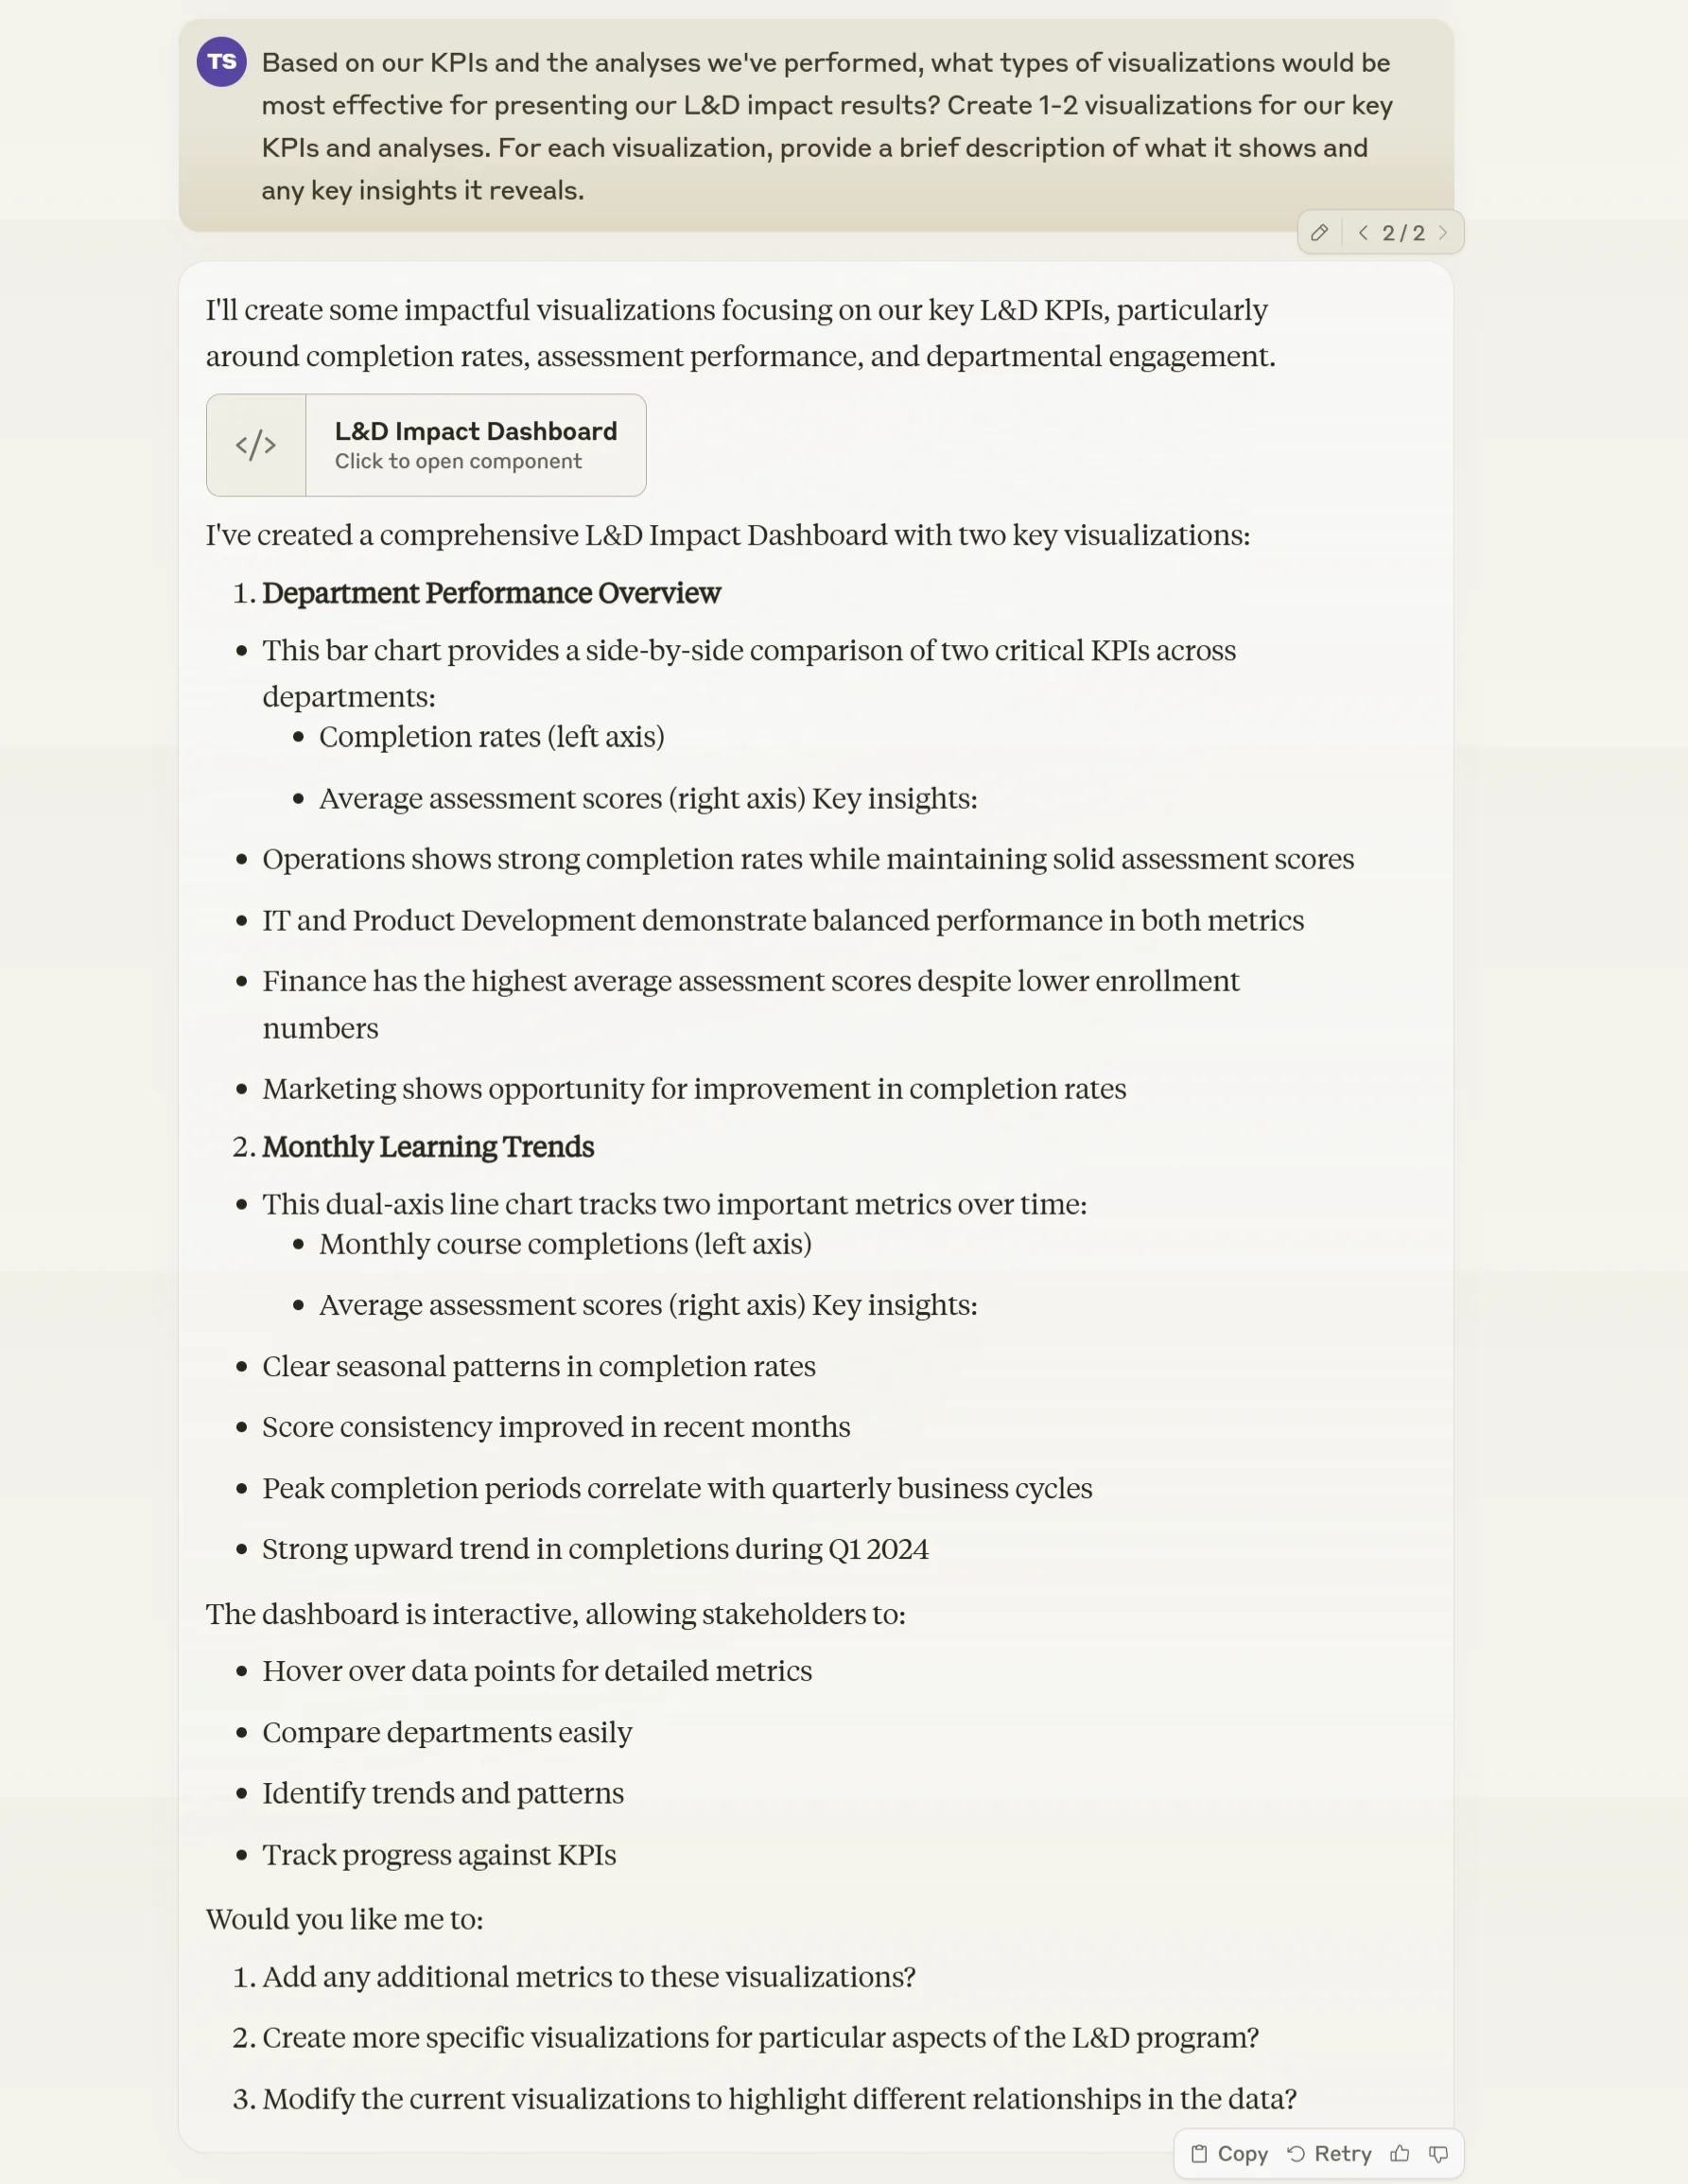
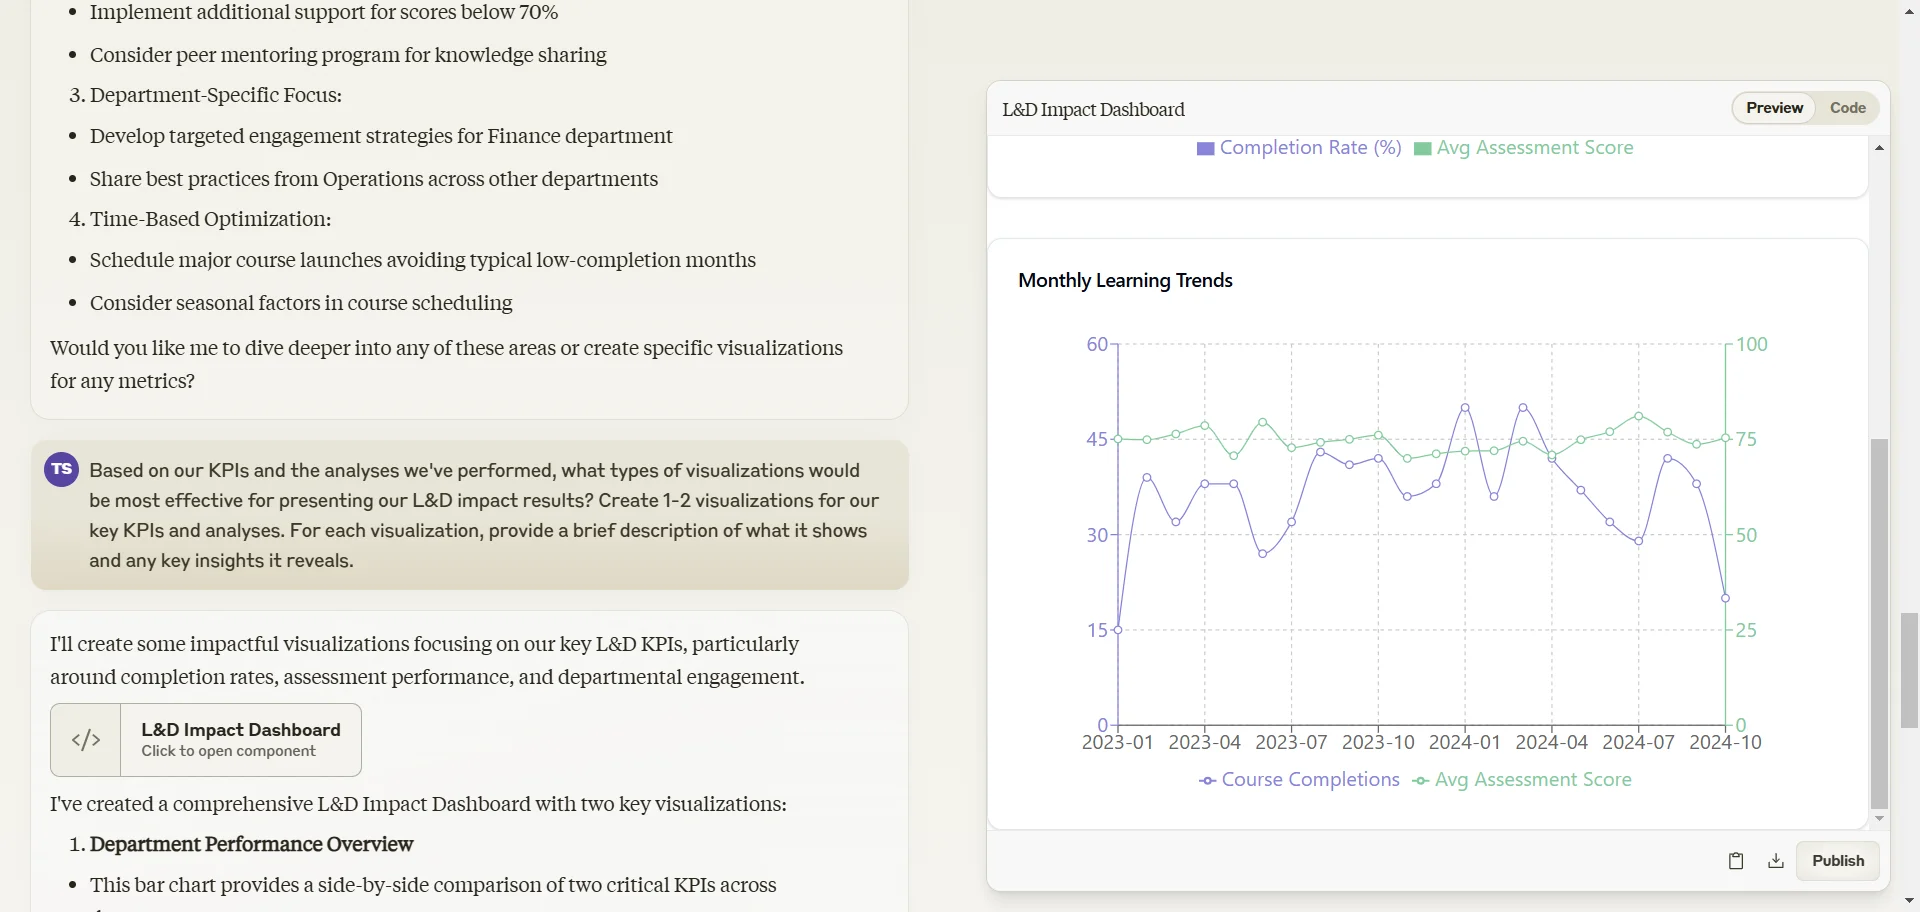
Review each visualization generated by Claude, ensuring they accurately represent your data and effectively communicate your key findings.
Step 4: Present findings and recommend actions
Now it's time to pull everything together into a compelling narrative that will drive action. We'll use Claude to help draft a comprehensive report and create a presentation deck.
Use the following prompt to generate your report and presentation outline:
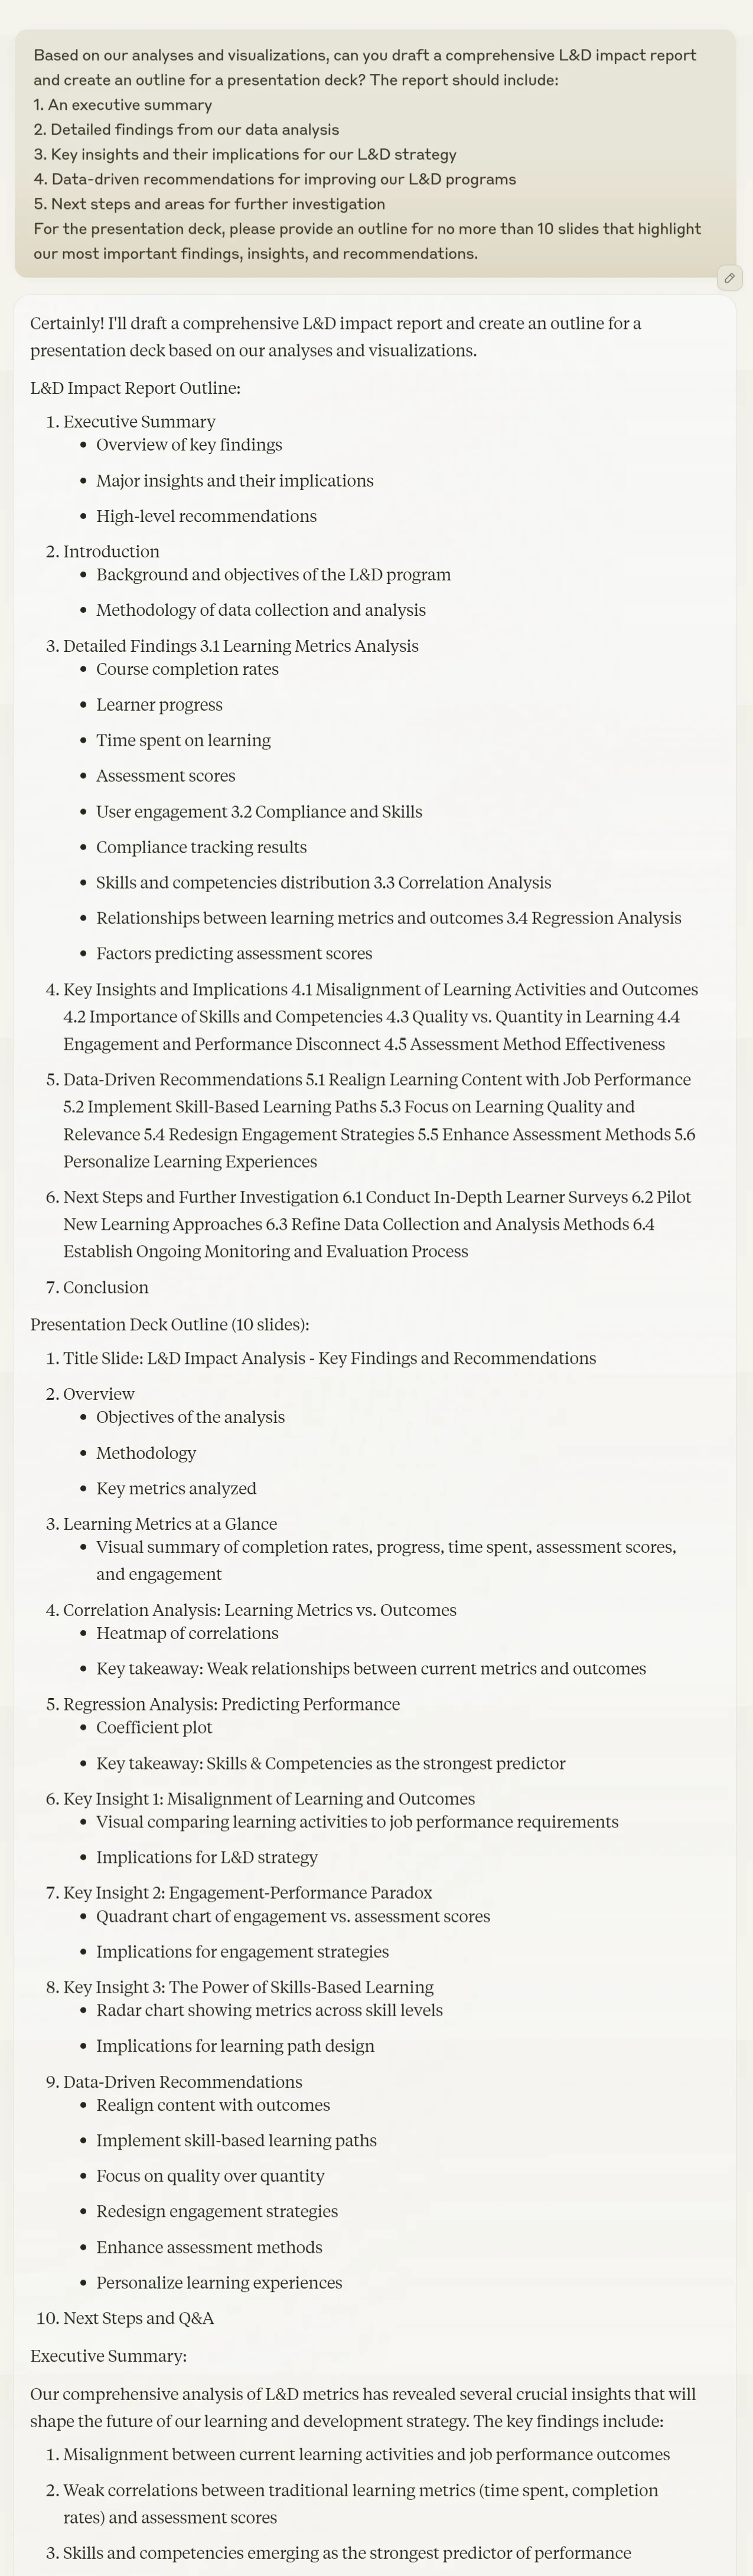
Based on our analyses and visualizations, can you draft a comprehensive L&D impact report and create an outline for a presentation deck? The report should include:
1. An executive summary
2. Detailed findings from our data analysis
3. Key insights and their implications for our L&D strategy
4. Data-driven recommendations for improving our L&D programs
5. Next steps and areas for further investigation
For the presentation deck, please provide an outline for no more than 10 slides that highlight our most important findings, insights, and recommendations.
Once you have the presentation outline, it's time to bring it to life. Remember how we used Gamma in Tutorial 3 (Develop training materials for your L&D strategy) of this course to transform our outline into a polished presentation? Let's do the same here.
This will help you effectively showcase your L&D impact report to various stakeholders, from C-suite executives to your L&D team.
Congratulations! You've now completed a comprehensive analysis of your L&D impact, created compelling visualizations, and prepared both a detailed report and a concise presentation. You're well-equipped to demonstrate the value of your L&D initiatives and make data-driven decisions to continually improve your programs.
Remember, this process isn't a one-time event. Regularly revisiting your KPIs, updating your analysis, and refining your L&D strategy based on data insights will ensure your learning programs continue to deliver maximum value to your organization.
This tutorial was created by Tanmay.