Perform visual SWOT analysis
Generate an interactive SWOT analysis and visualization with Mapify.
2024-11-13
Whether you're aiming to present to stakeholders or simply looking to clarify your strategic thinking, creating a visual SWOT analysis can streamline processes and enhance communication.
However, turning data insights into a visually engaging and easily digestible format can be challenging. So, in this tutorial, we’ll use Mapify to generate a visual SWOT analysis for a business idea from a simple prompt. By the end, you'll have a comprehensive and visually appealing SWOT analysis ready to inform and share your strategic decisions.
In this tutorial, you will learn how to:
- Generate a visual SWOT analysis from a prompt
- Brainstorm ideas to capitalize on strengths
- Ideate counter-measures to offset weaknesses
- Update your SWOT analysis format and export it into multiple formats
Step 1: Generate a visual SWOT analysis from a prompt
To get started, create a free account on the Mapify website and click the “New Map” button on the app dashboard.
.webp)
Mapify provides several different input options as the source data for your visualization. You can enter a prompt, upload documents, provide website or YouTube URLs, and more. For this tutorial, since we want to create a SWOT analysis for a business idea, we’ll use the Prompt option and ask for a SWOT analysis for our business idea.
Sample prompt:
SWOT analysis for [insert business idea].
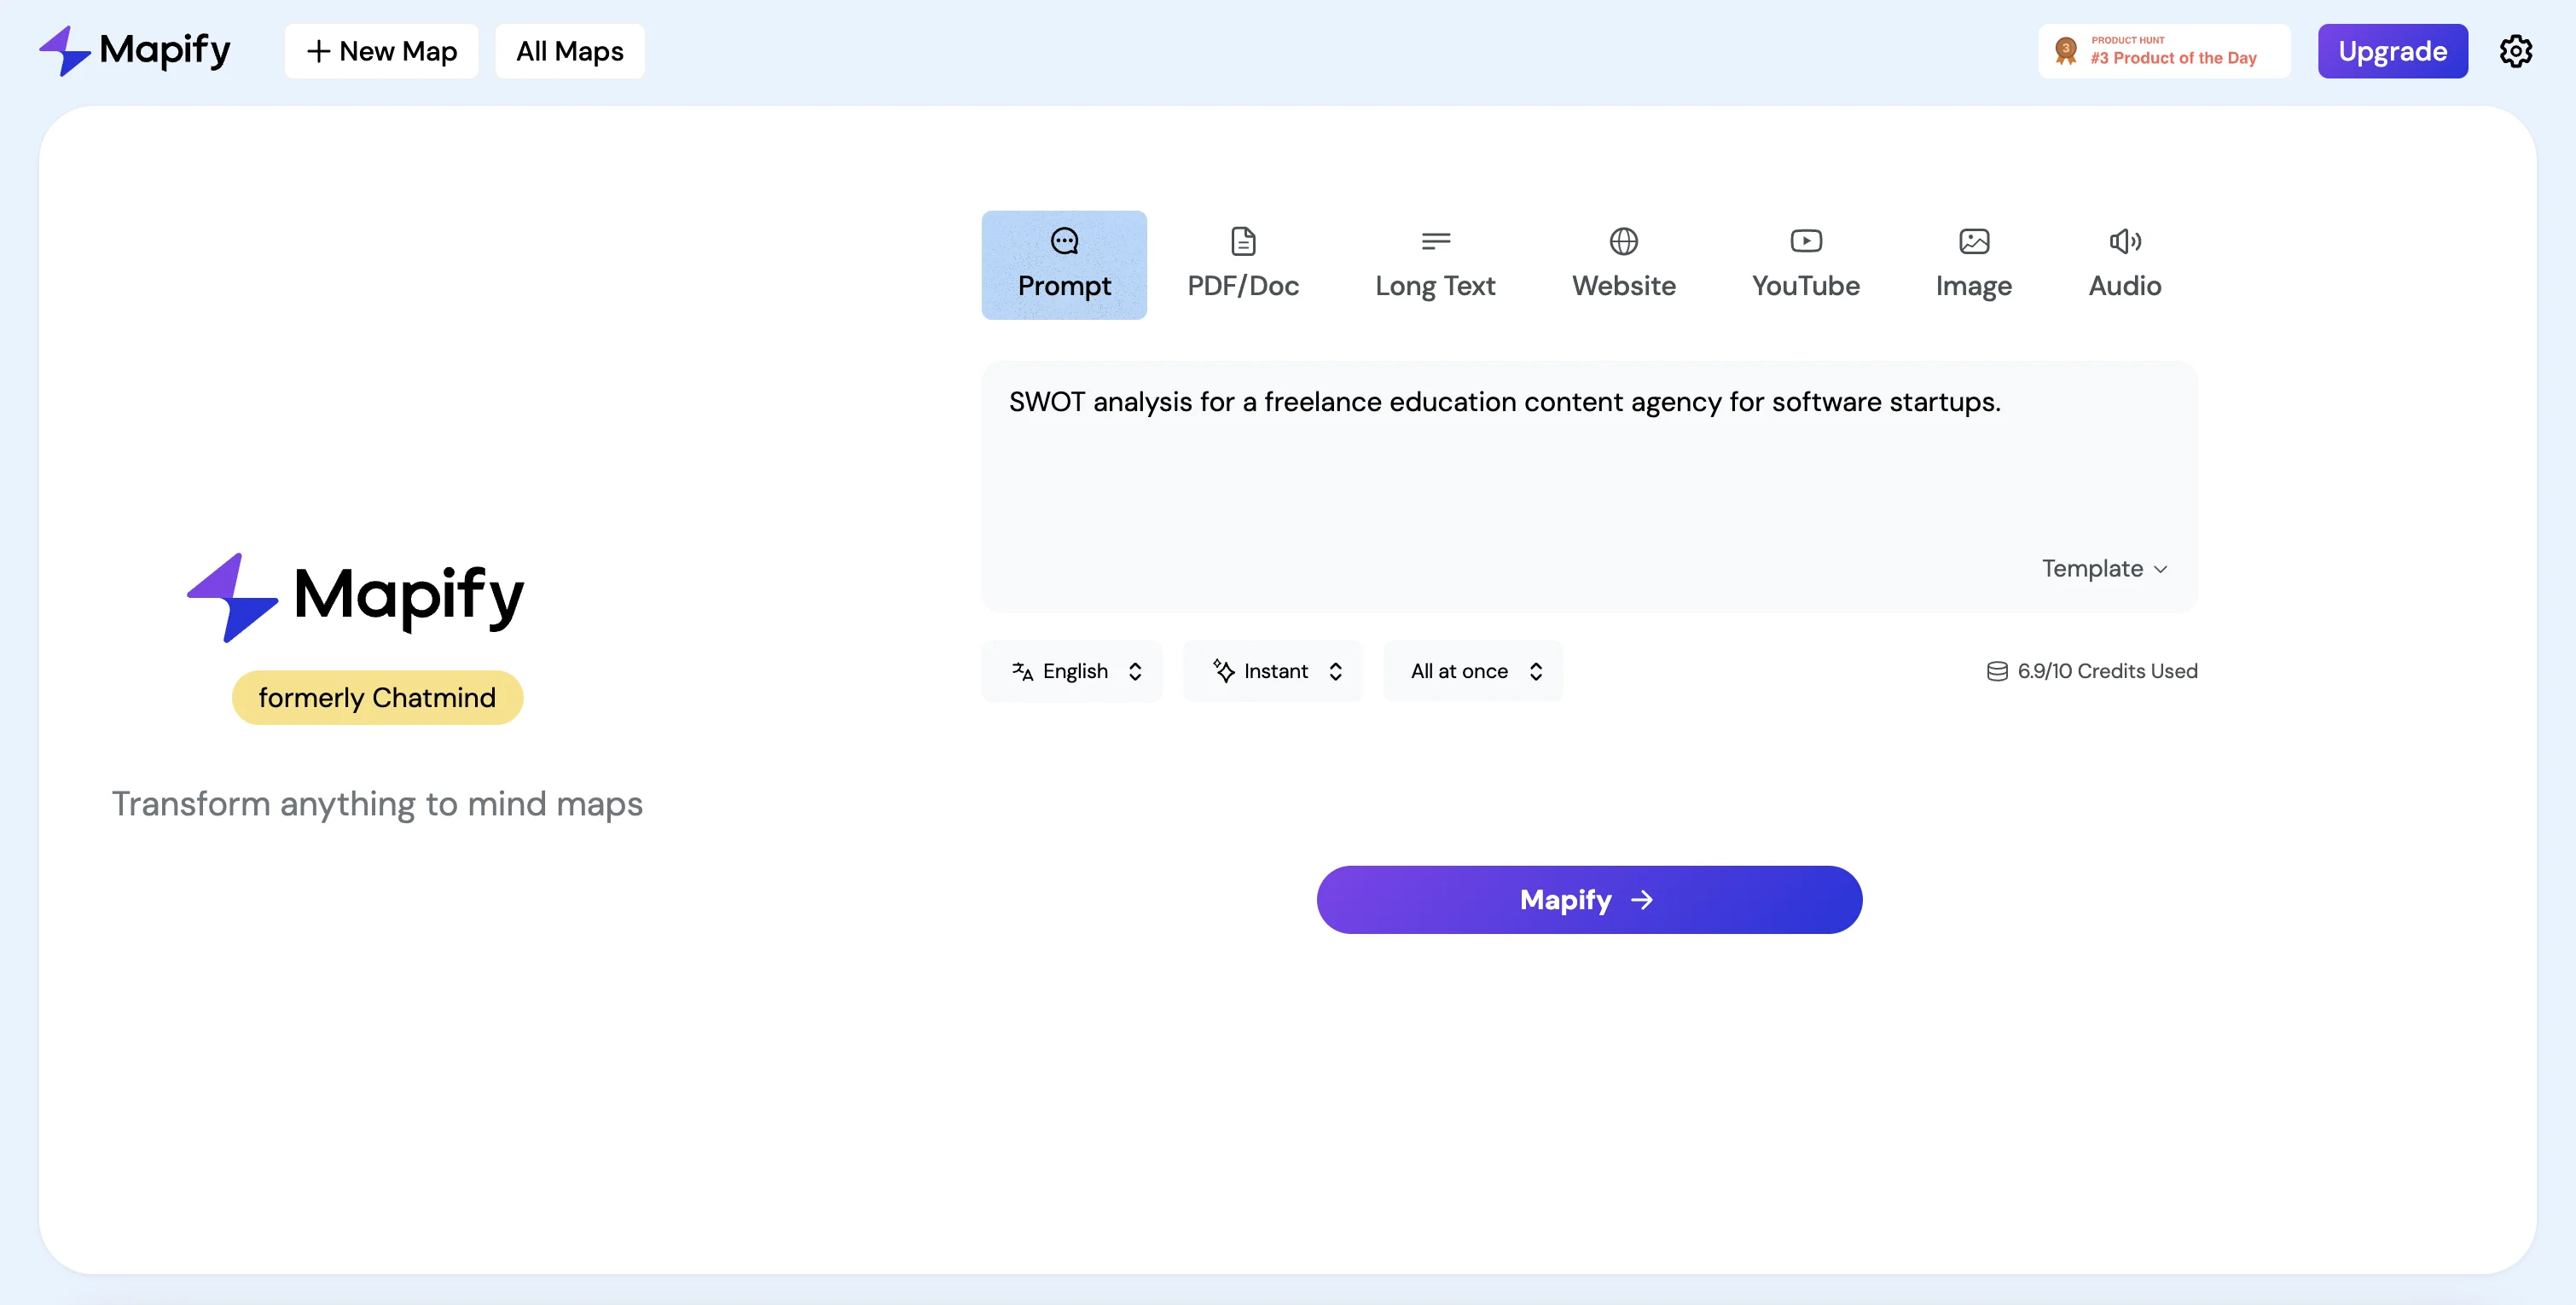
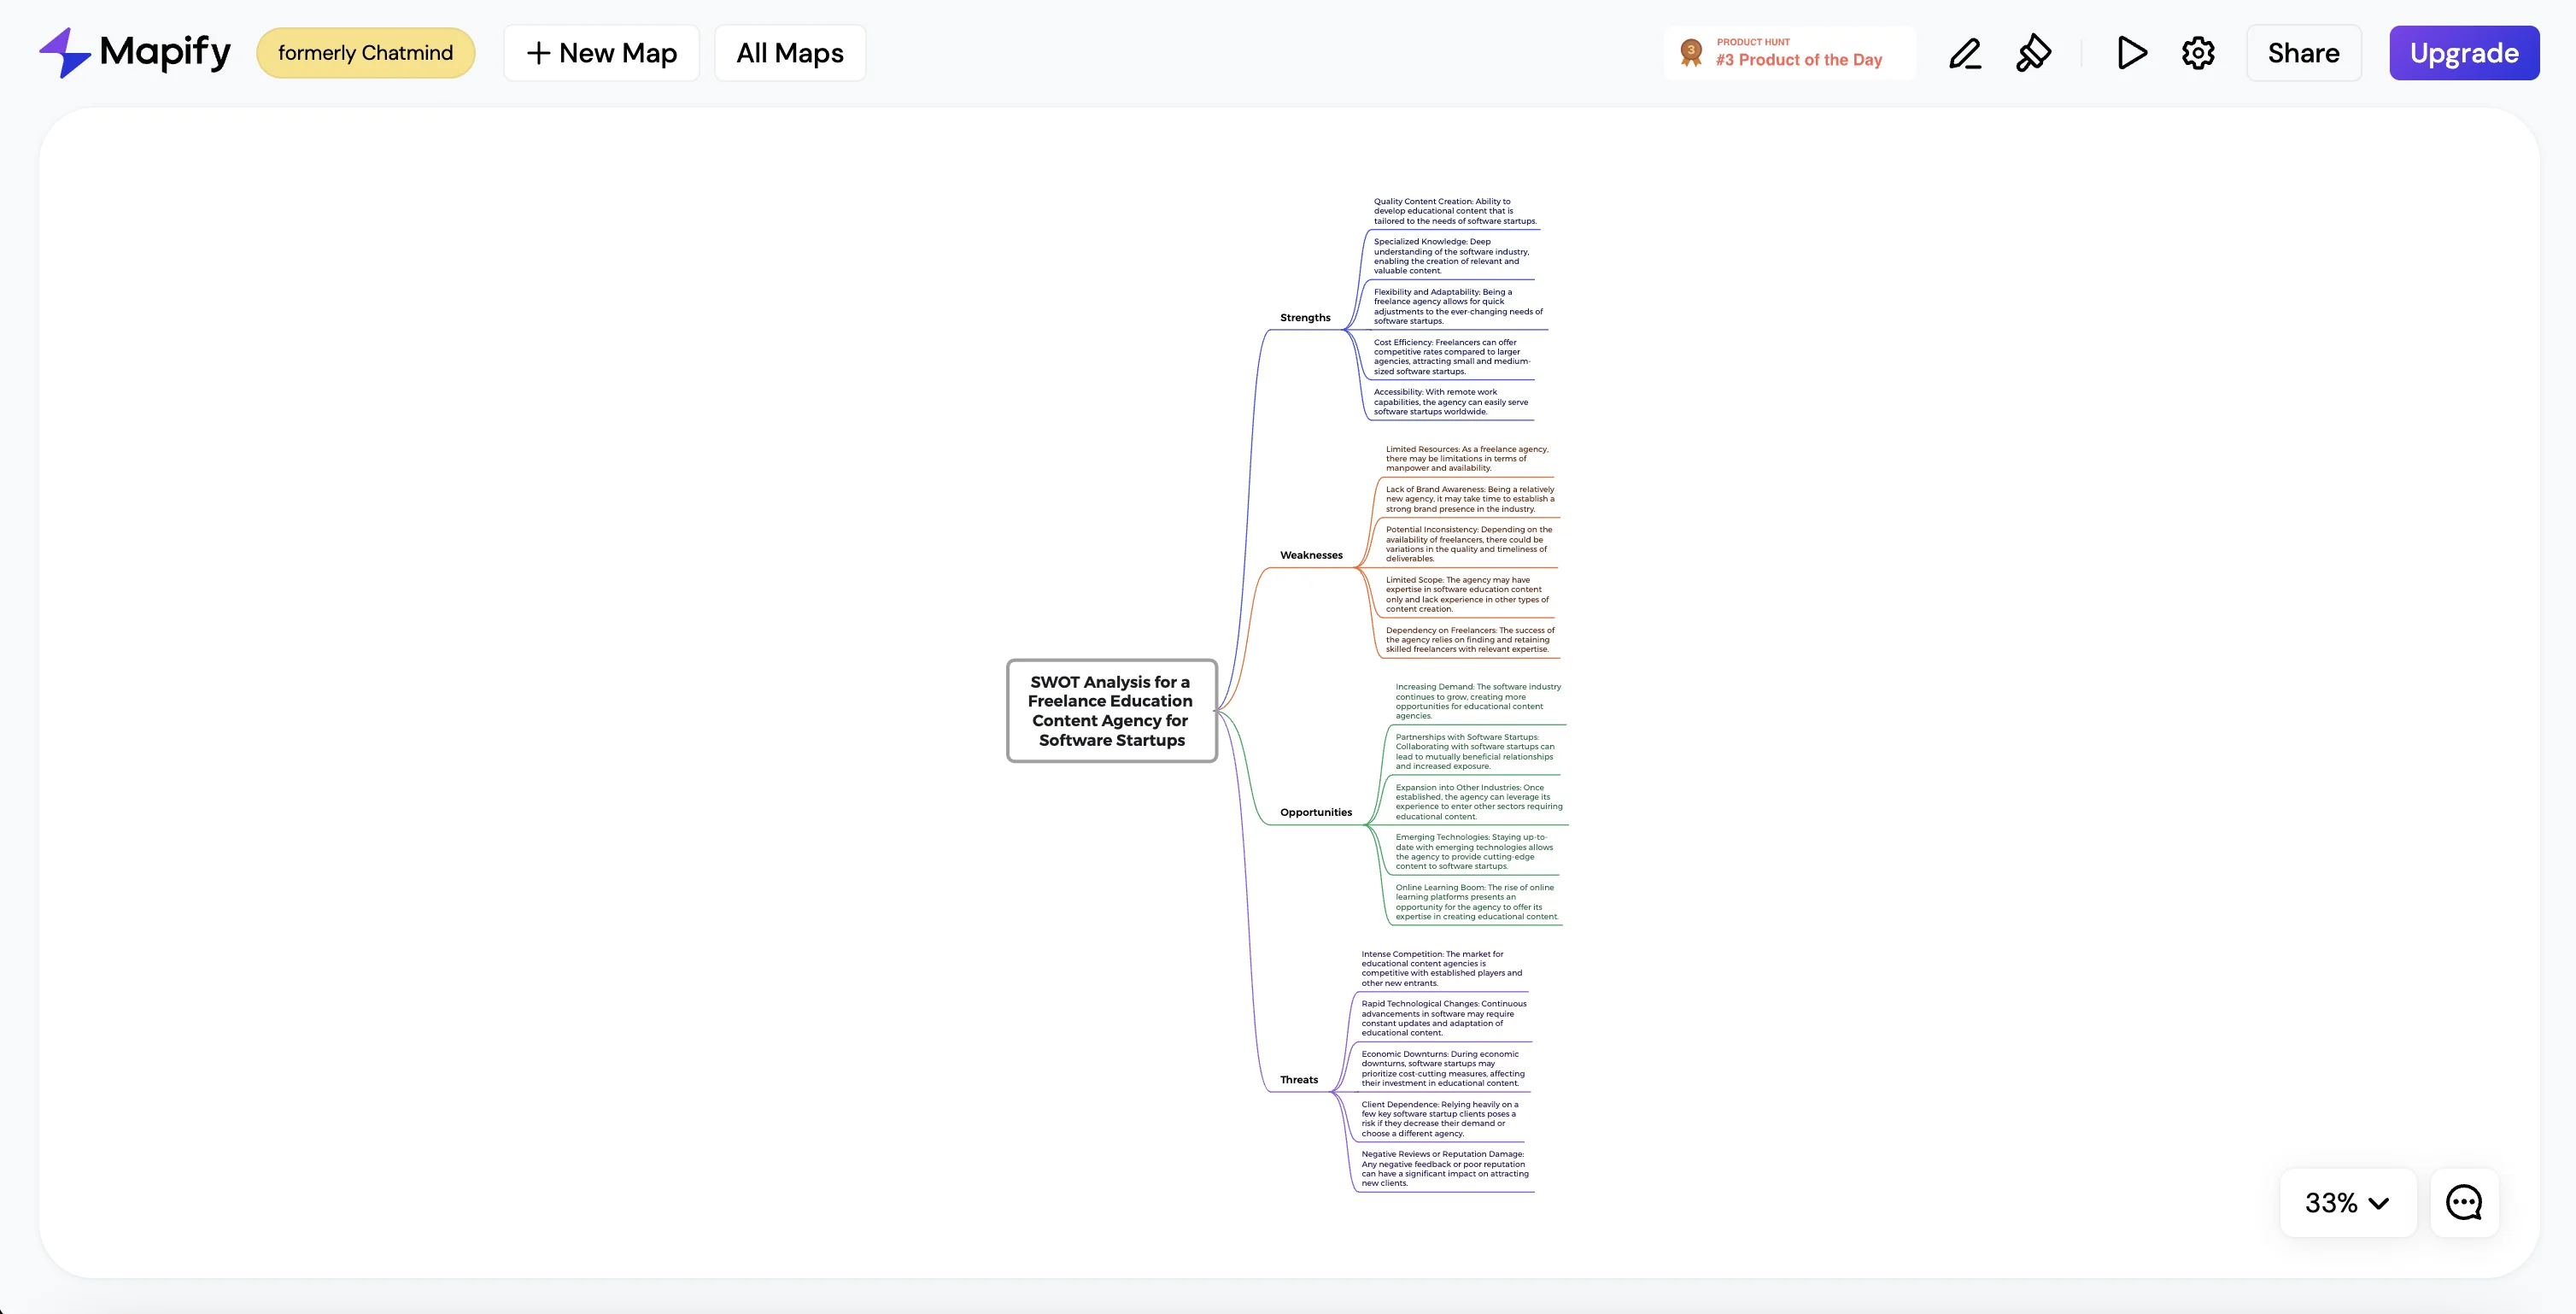
Once we submit our prompt, Mapify will generate a populated, visual SWOT analysis for our idea.
Step 2: Brainstorm ideas to capitalize on strengths
What’s great about Mapify is that not only will it create our SWOT analysis visualization, but we can chat with it via its chat window. To do this, click the chat bubble in the bottom right corner of the app.
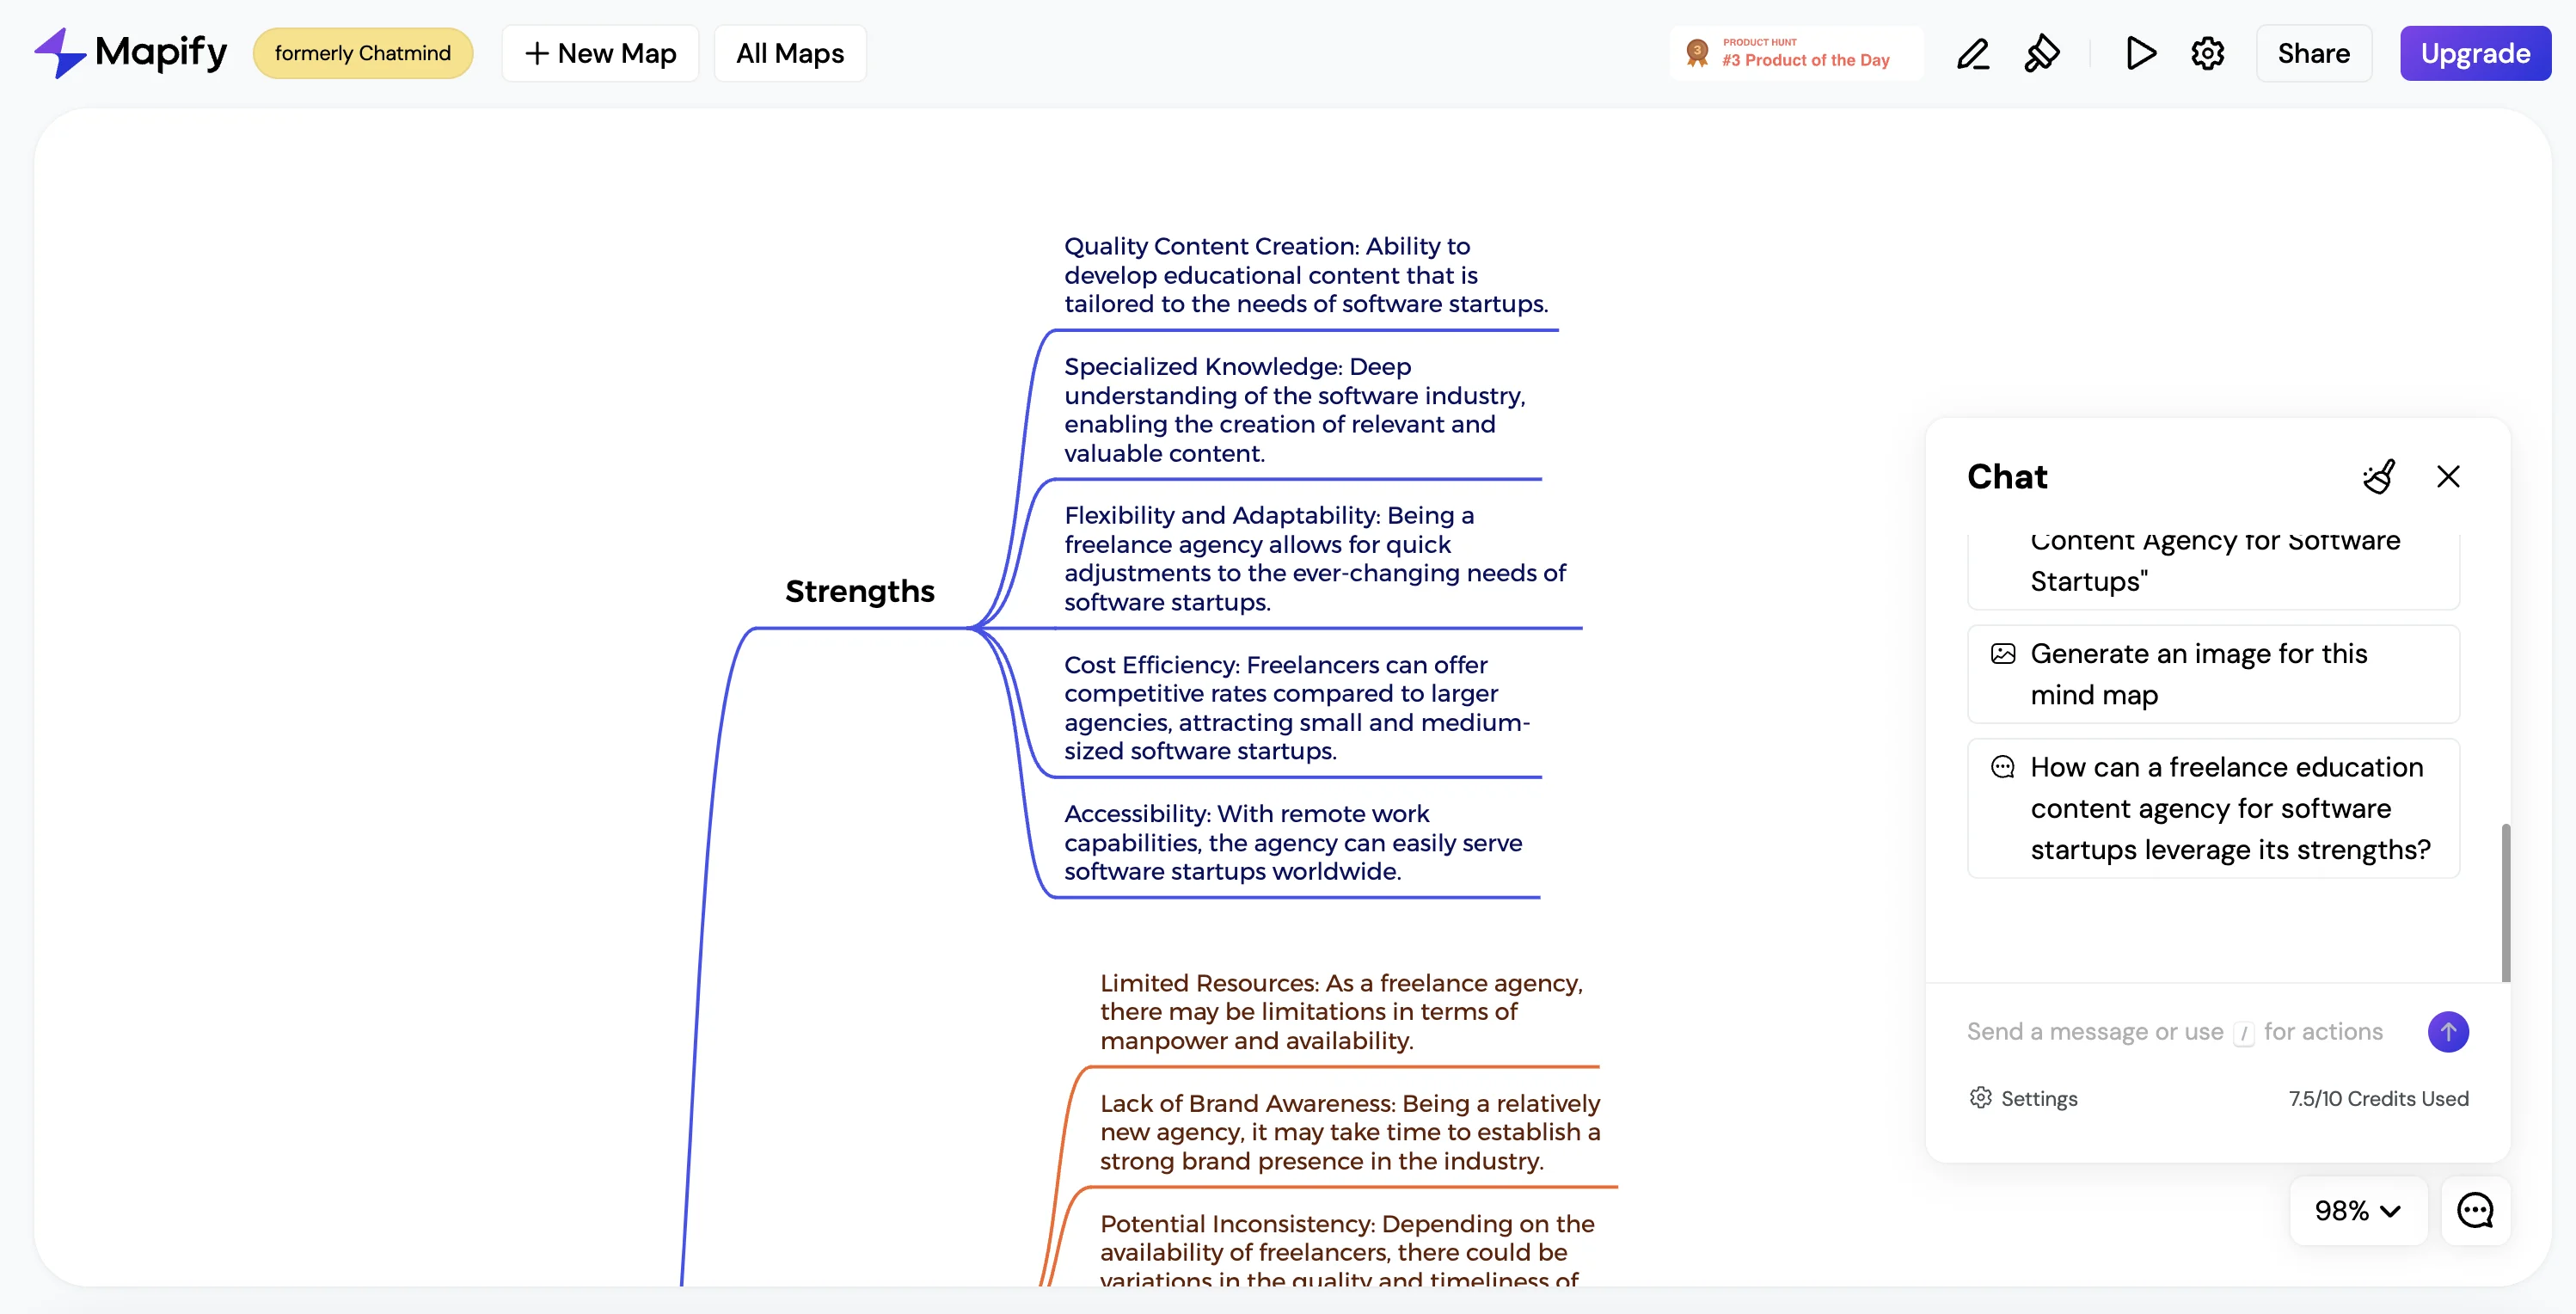
We’re going to ask Mapify how this proposed business idea can leverage its strengths.
Sample prompt:
How can a [insert business idea] leverage its strengths?
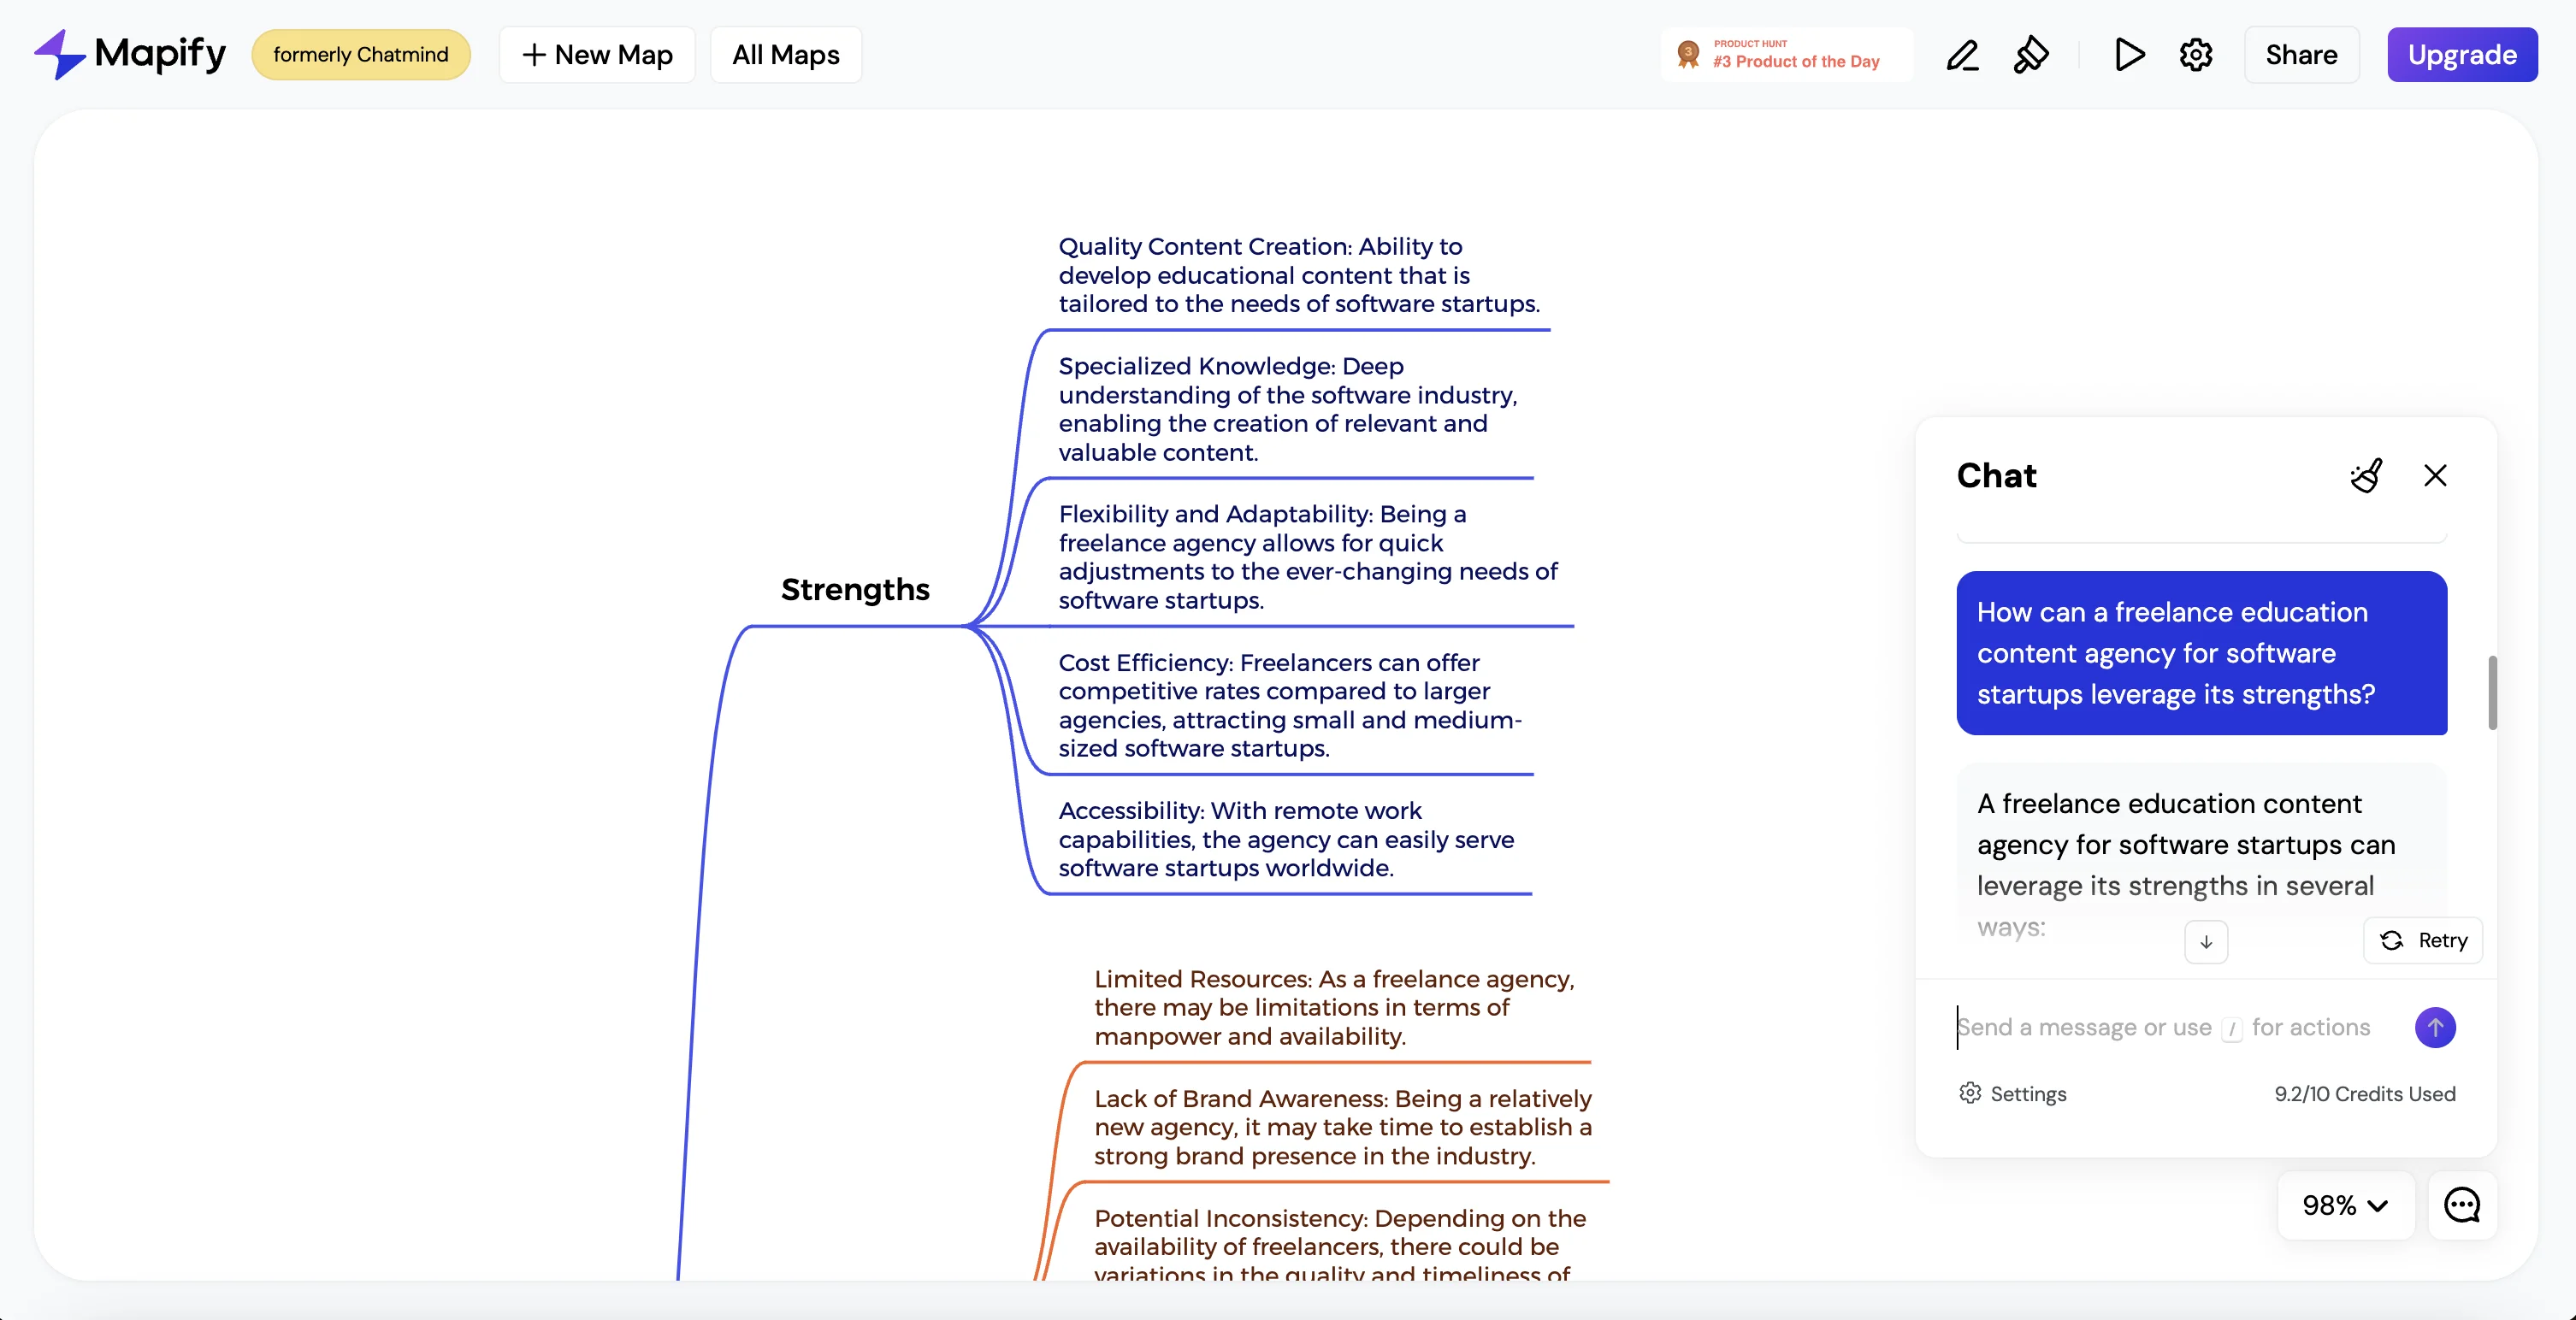
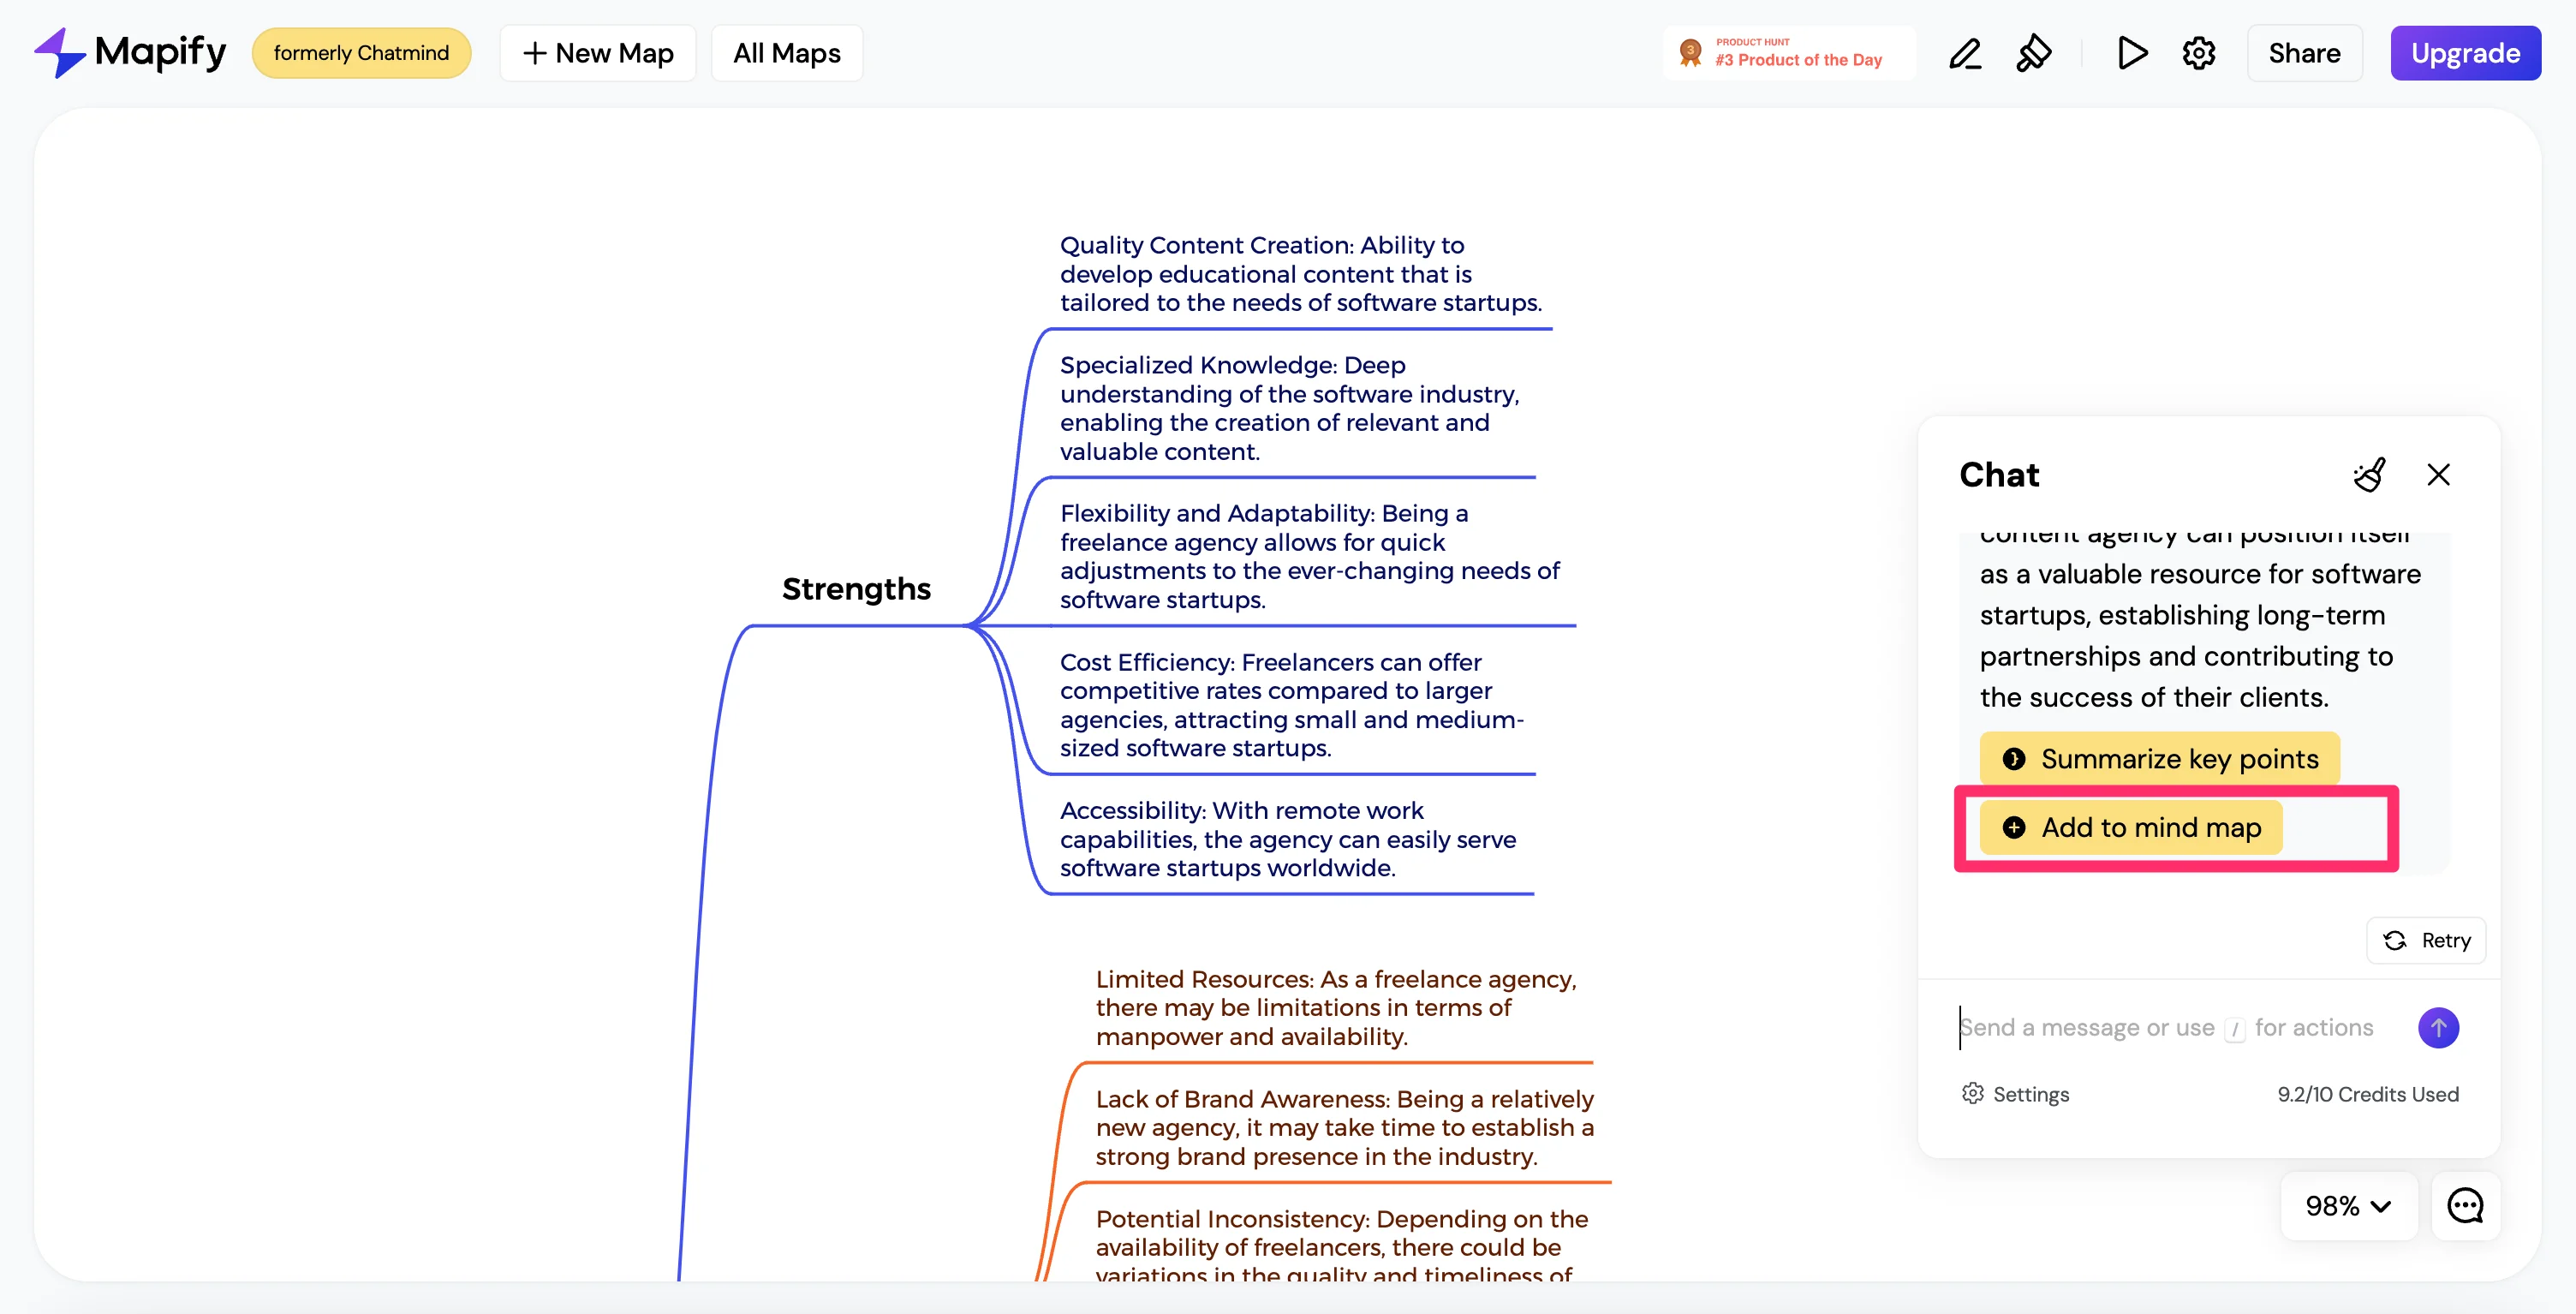
Mapify will generate a response in the chat window, which you can either summarize or add directly to your visual SWOT analysis. To add it to your visual SWOT analysis, click the “Add to mind map” button.
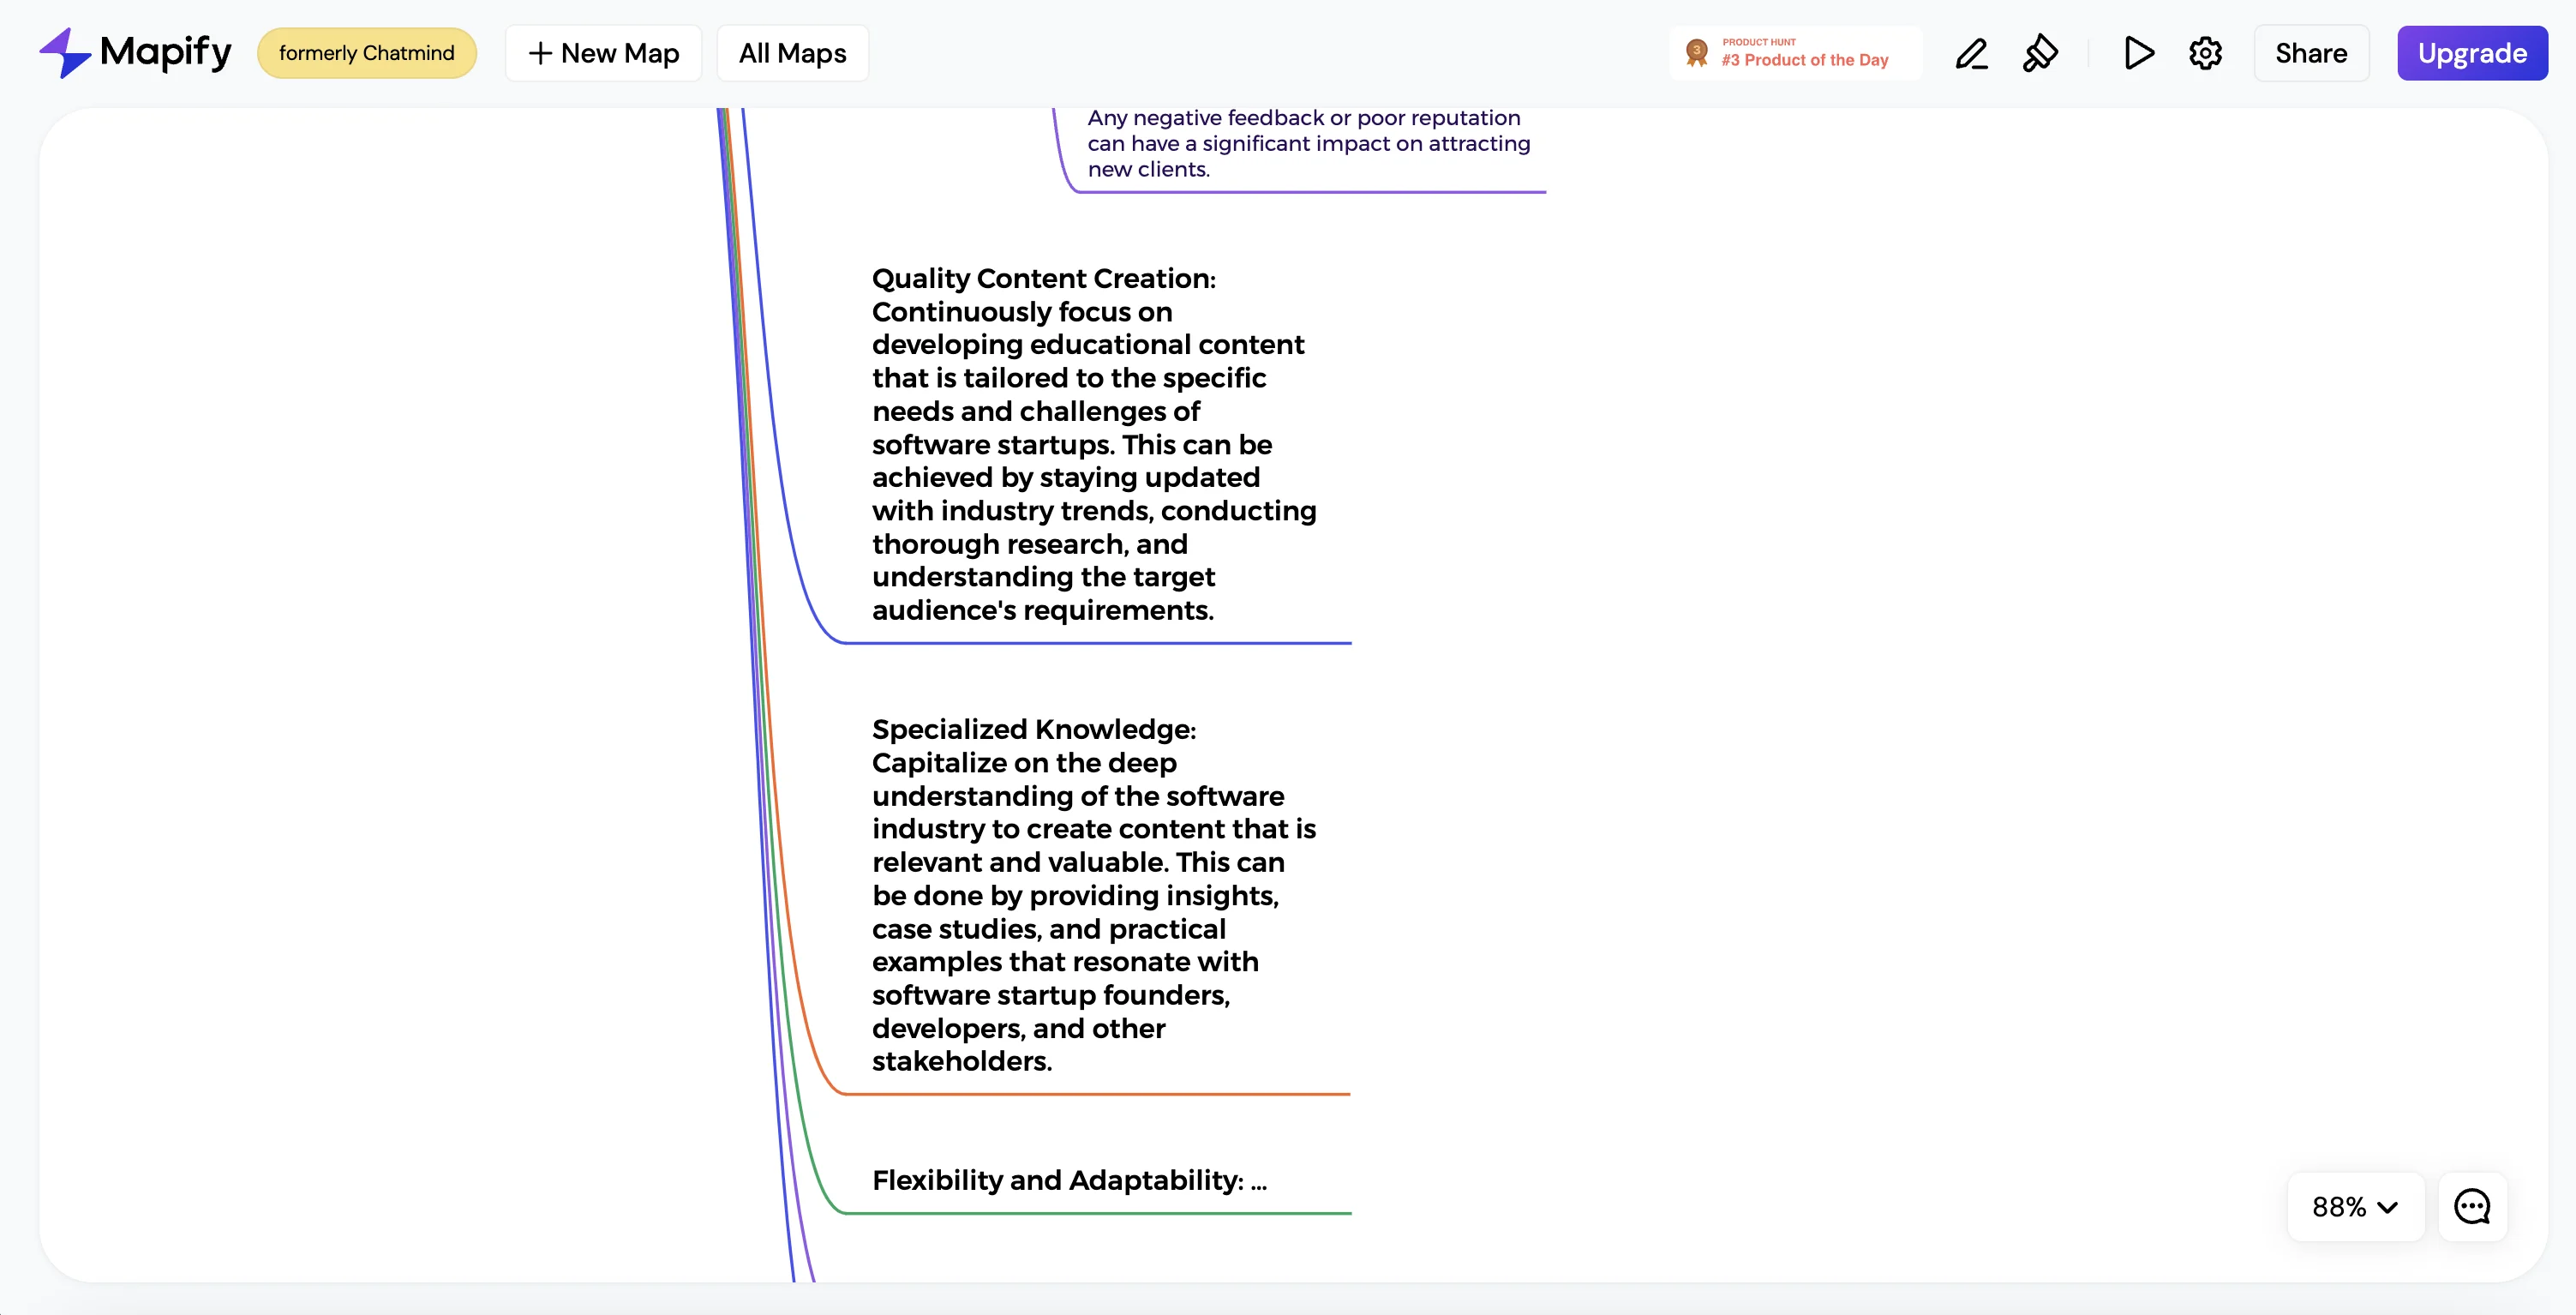
The new ideas will then be added to the visual SWOT analysis.
Step 3: Ideate counter-measures to offset weaknesses
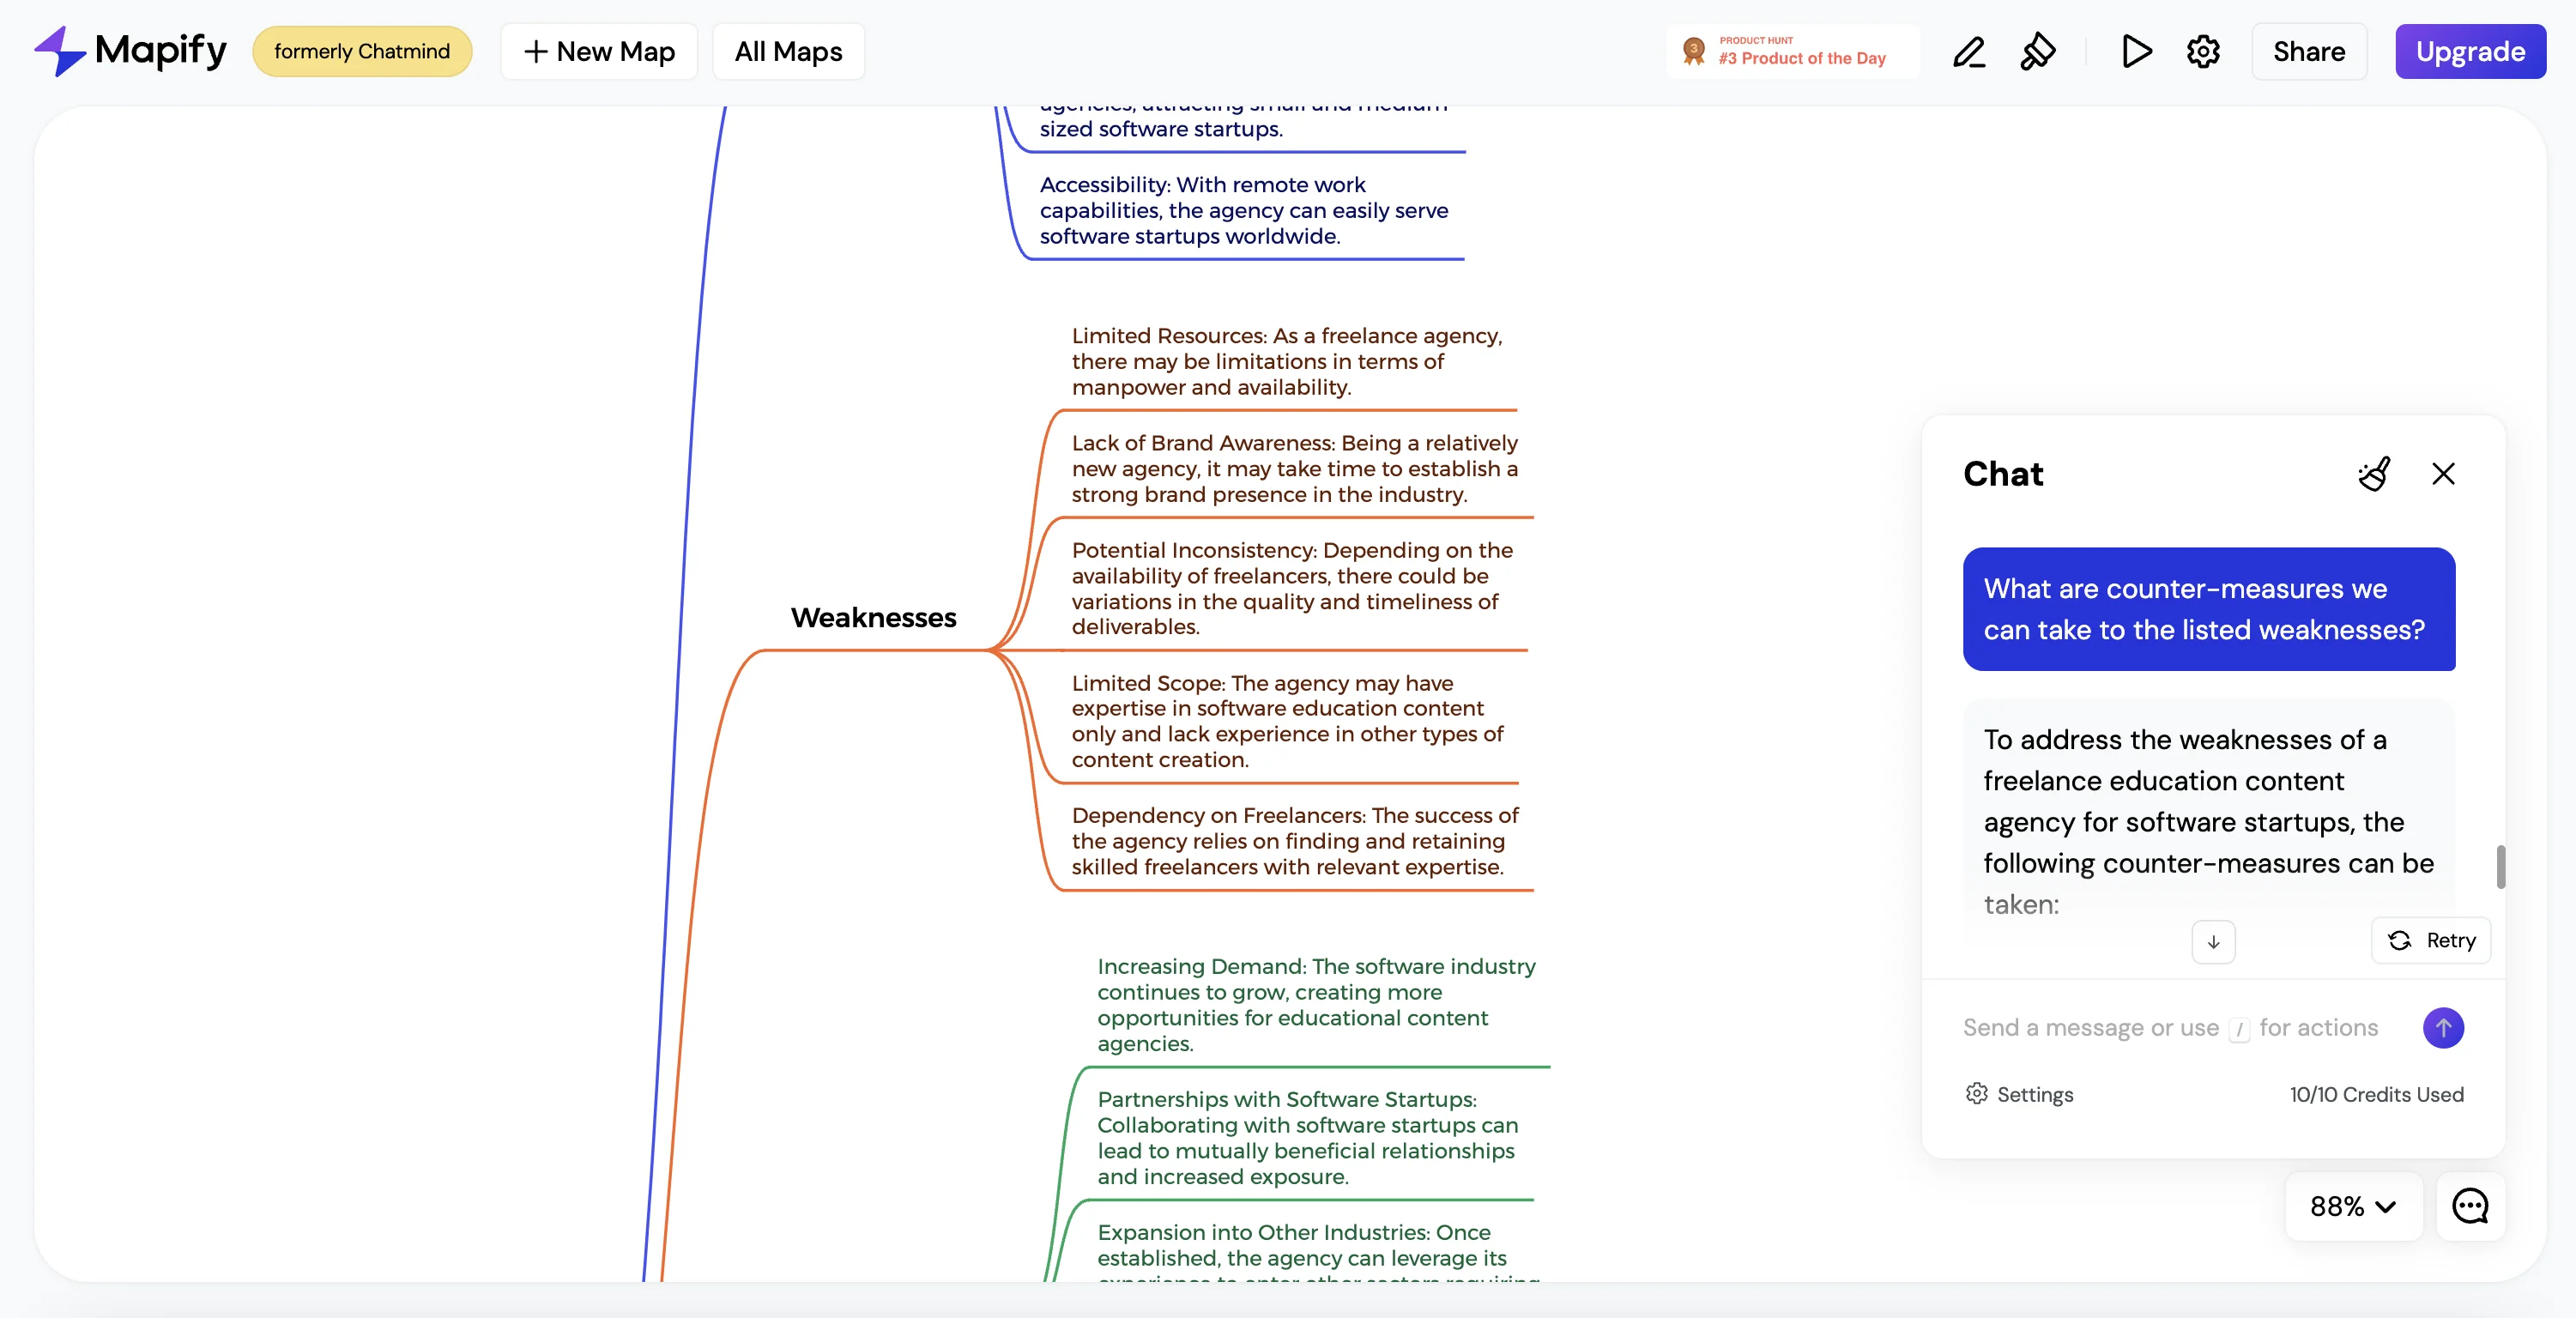
We can also ideate on counter-measures to offset weaknesses in the business idea. To do this, go back to the chat and ask for recommendations for countermeasures to offset the weaknesses in the SWOT analysis.
Sample prompt:
What are countermeasures we can take to the listed weaknesses?
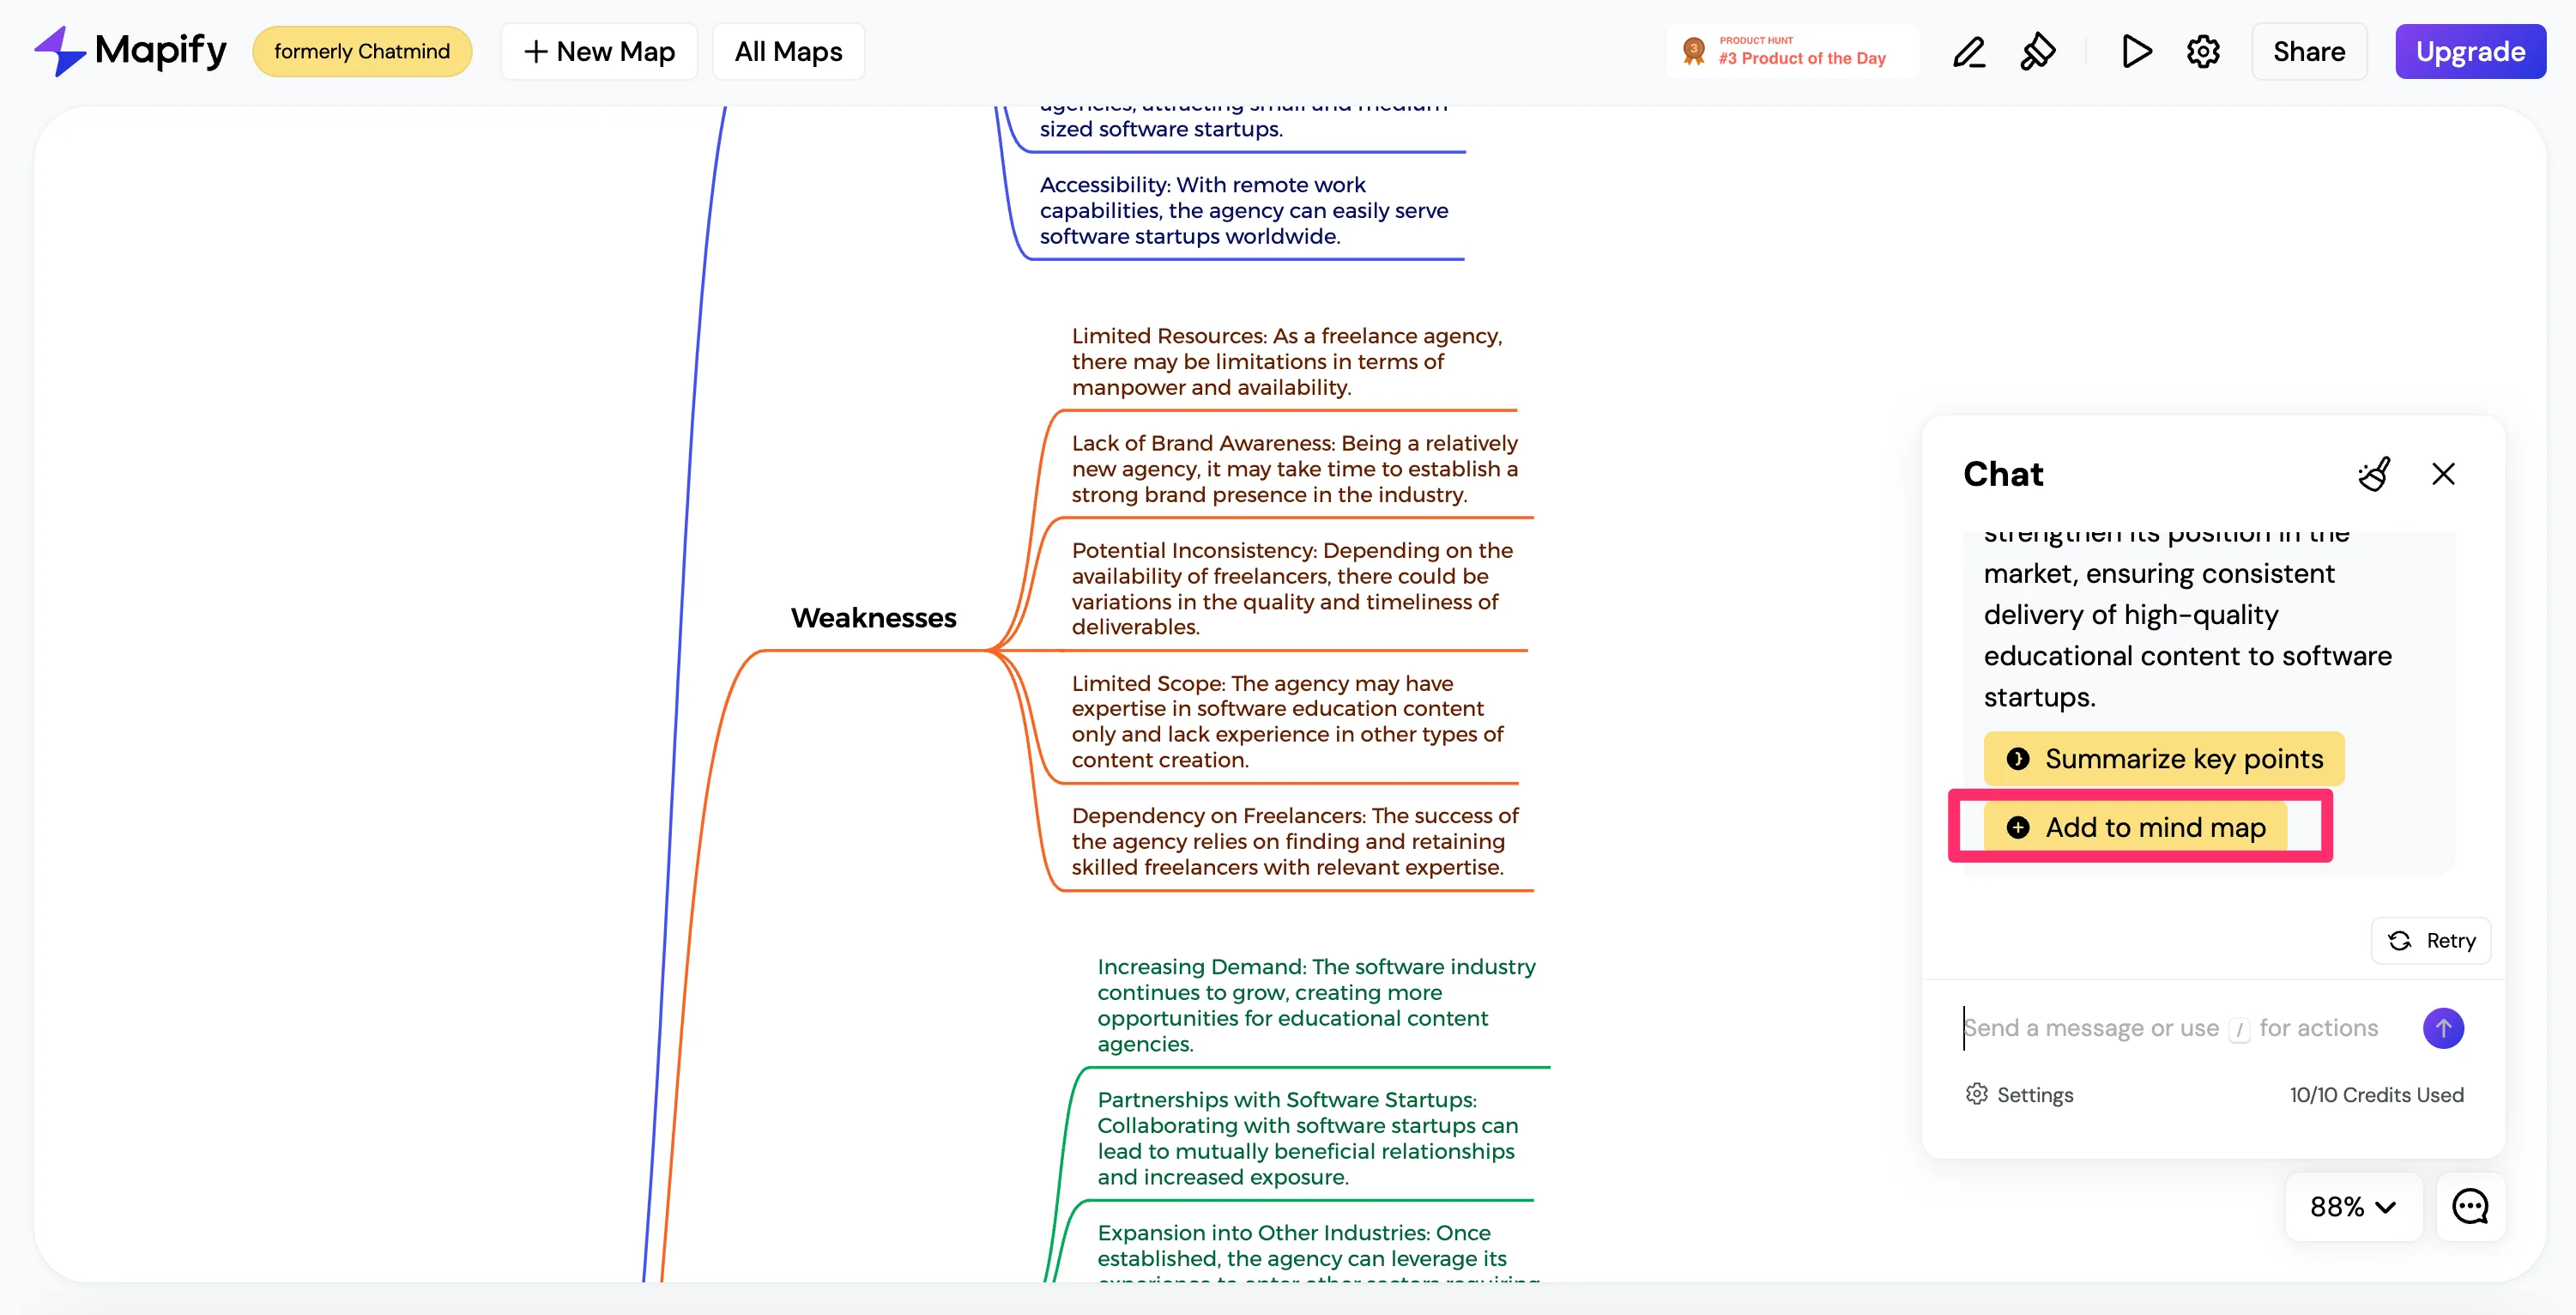
Similarly to the generated ideas to capitalize on strengths, you can summarize the key points for these counter-measures and/or add them to the SWOT analysis visualization as well.
Step 4: Update your SWOT analysis format and export it into multiple formats
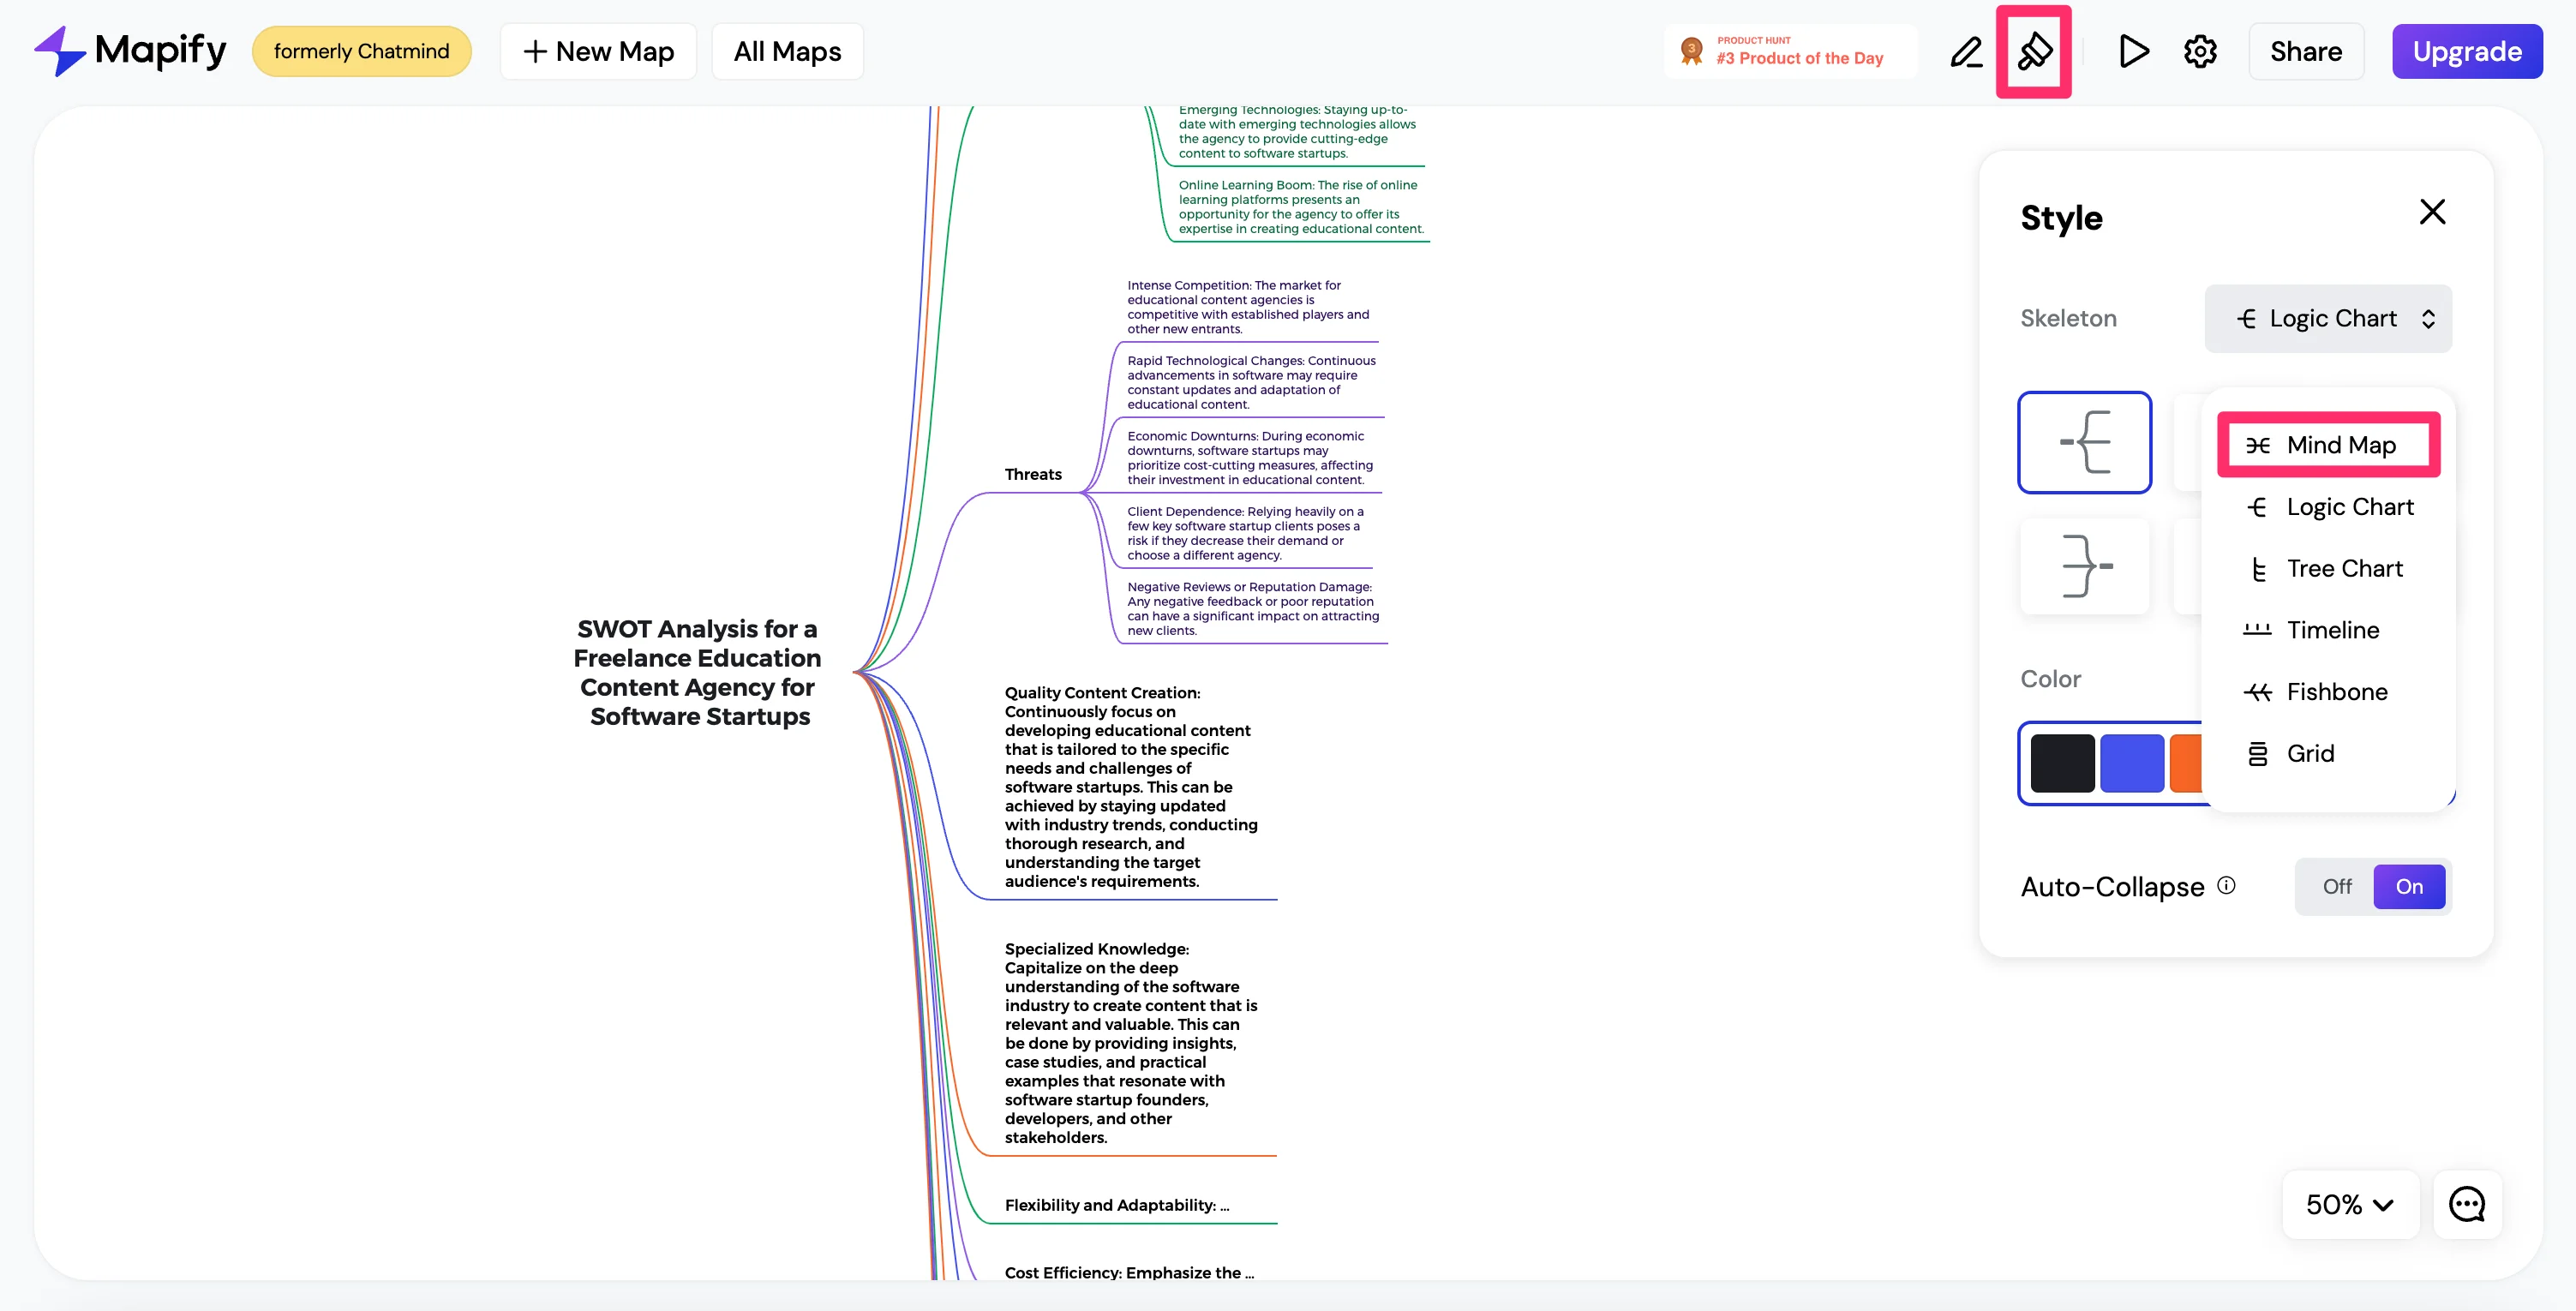
Finally, once you complete your SWOT analysis, you can update the visualization format and export it into several formats. To update the format, click the paintbrush icon in the top right navigation. Click the “Skeleton” dropdown and select a different format. We’re going to update ours to a Mind Map.
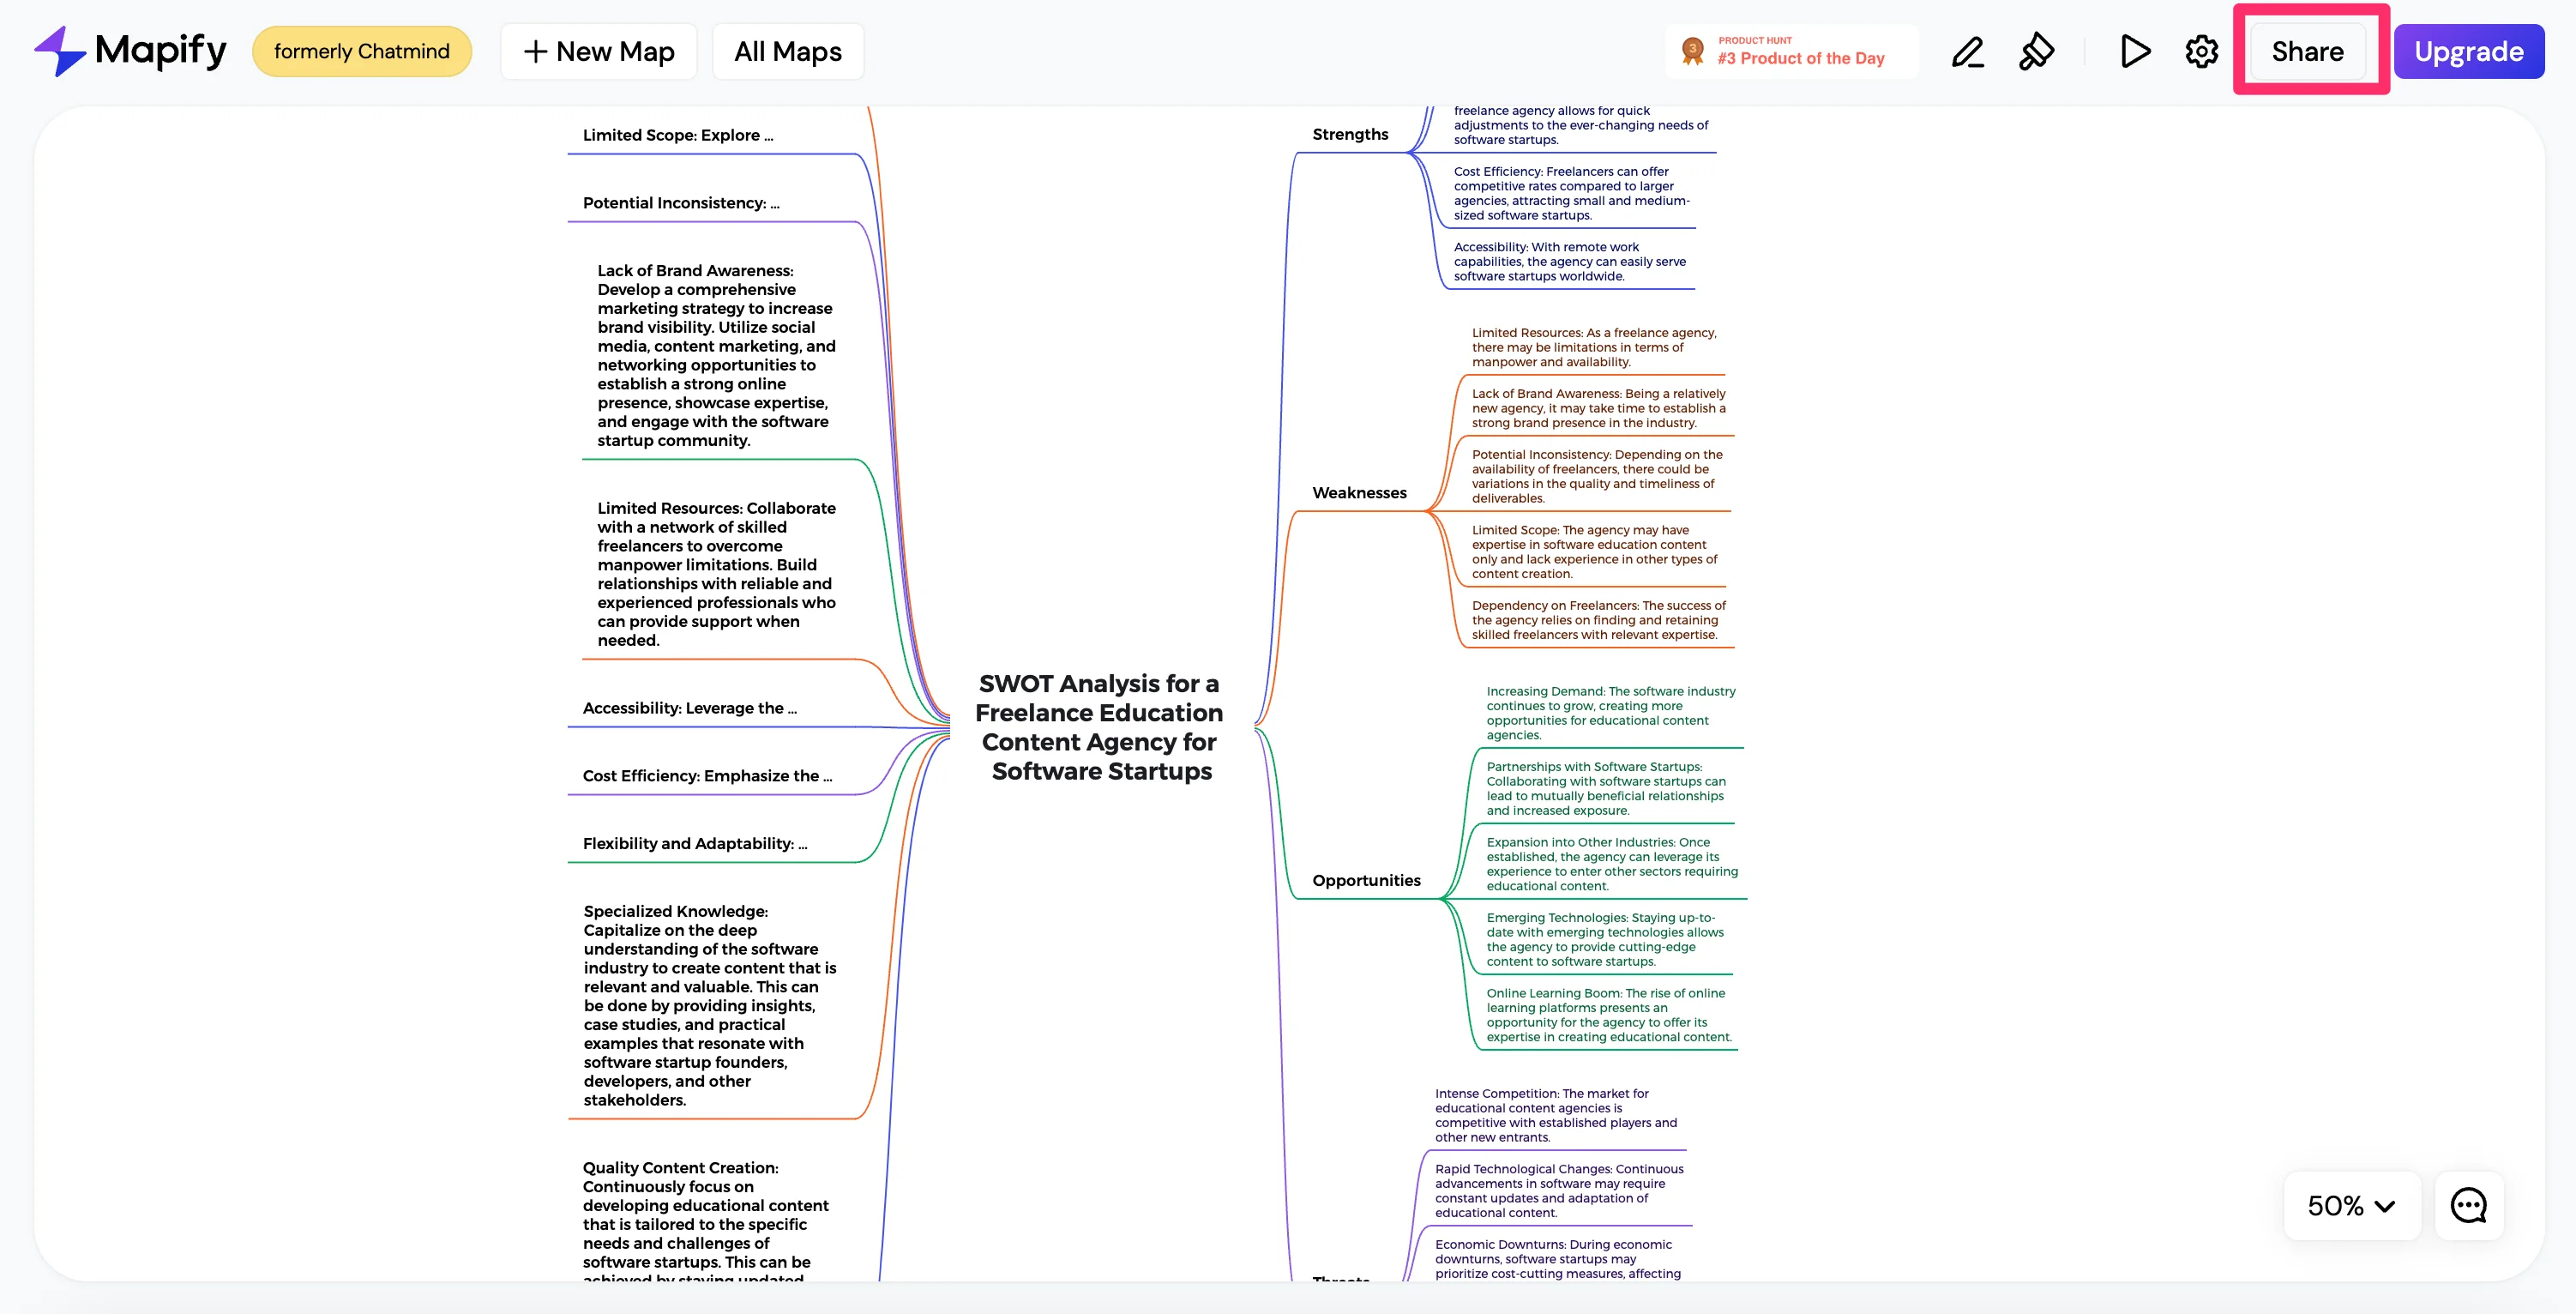
From there, you can export the visualization by clicking the “Share” button in the top right navigation.
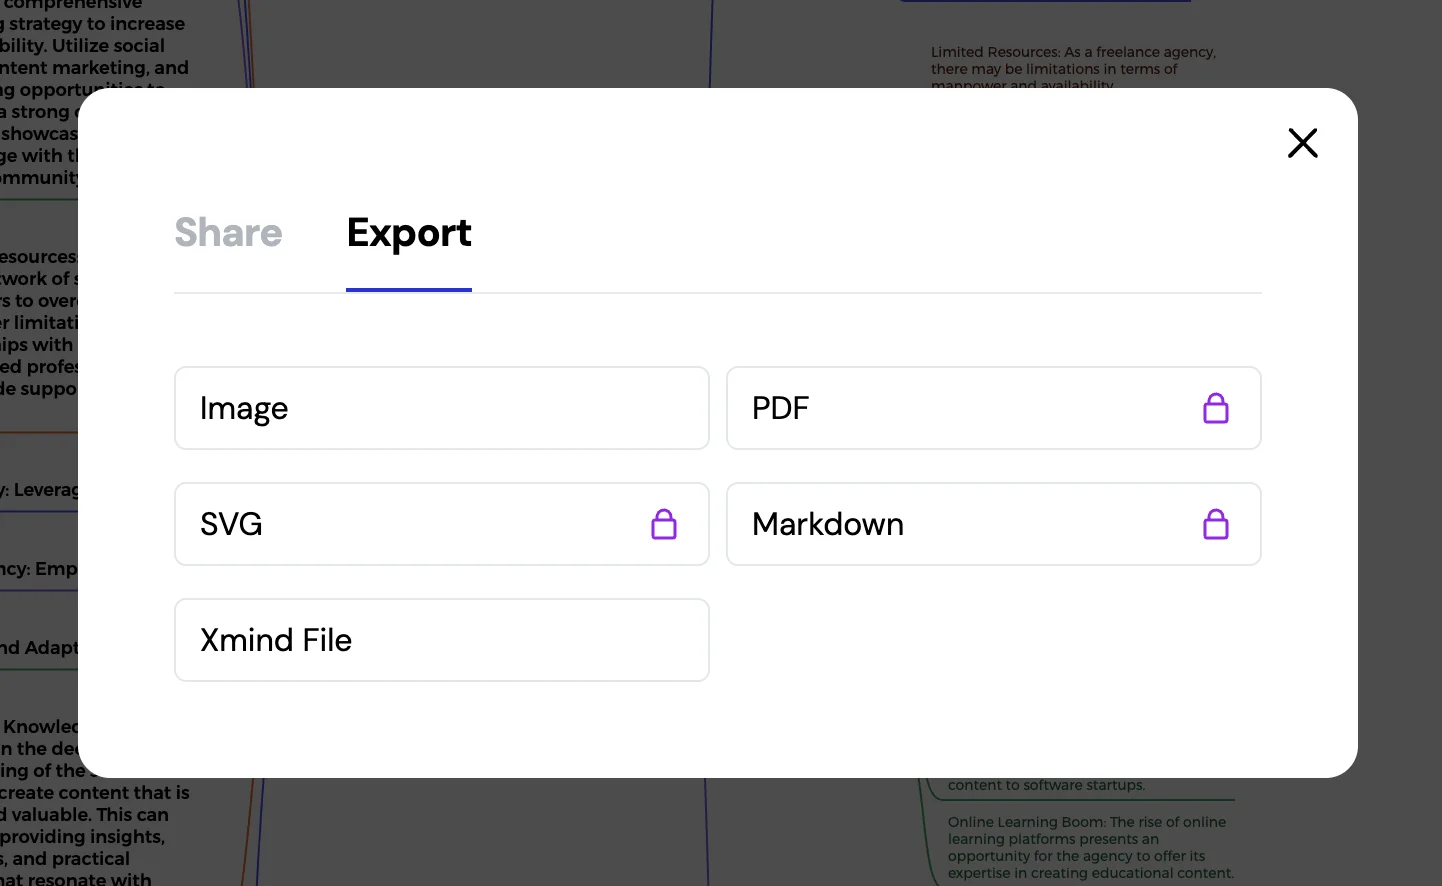
On the Export tab, you can export your SWOT analysis as an image, PDF, SVG, or more formats, making it easy to include in a presentation or other set of materials.
This tutorial was created by Garrett.