Project tracking and reporting
Create a customized project management app in Airtable with their AI co-builder.
2024-12-19
Welcome to the third lesson of our Automating project management with AI course!
In this tutorial, we'll take the project plan we made with ChatGPT and build a simple way to track and report on our project using Airtable.
Airtable has a helpful AI tool that can quickly create ready-to-use project management systems. We'll use their templates and AI helper to set up our tracking system.
Steps we’ll follow in this tutorial:
- Create an Airtable project management app
- Upload your project plan data
- Add reporting and specialized interfaces
Tools needed:
- Airtable
Let’s get into it!
Create an Airtable project management base with AI
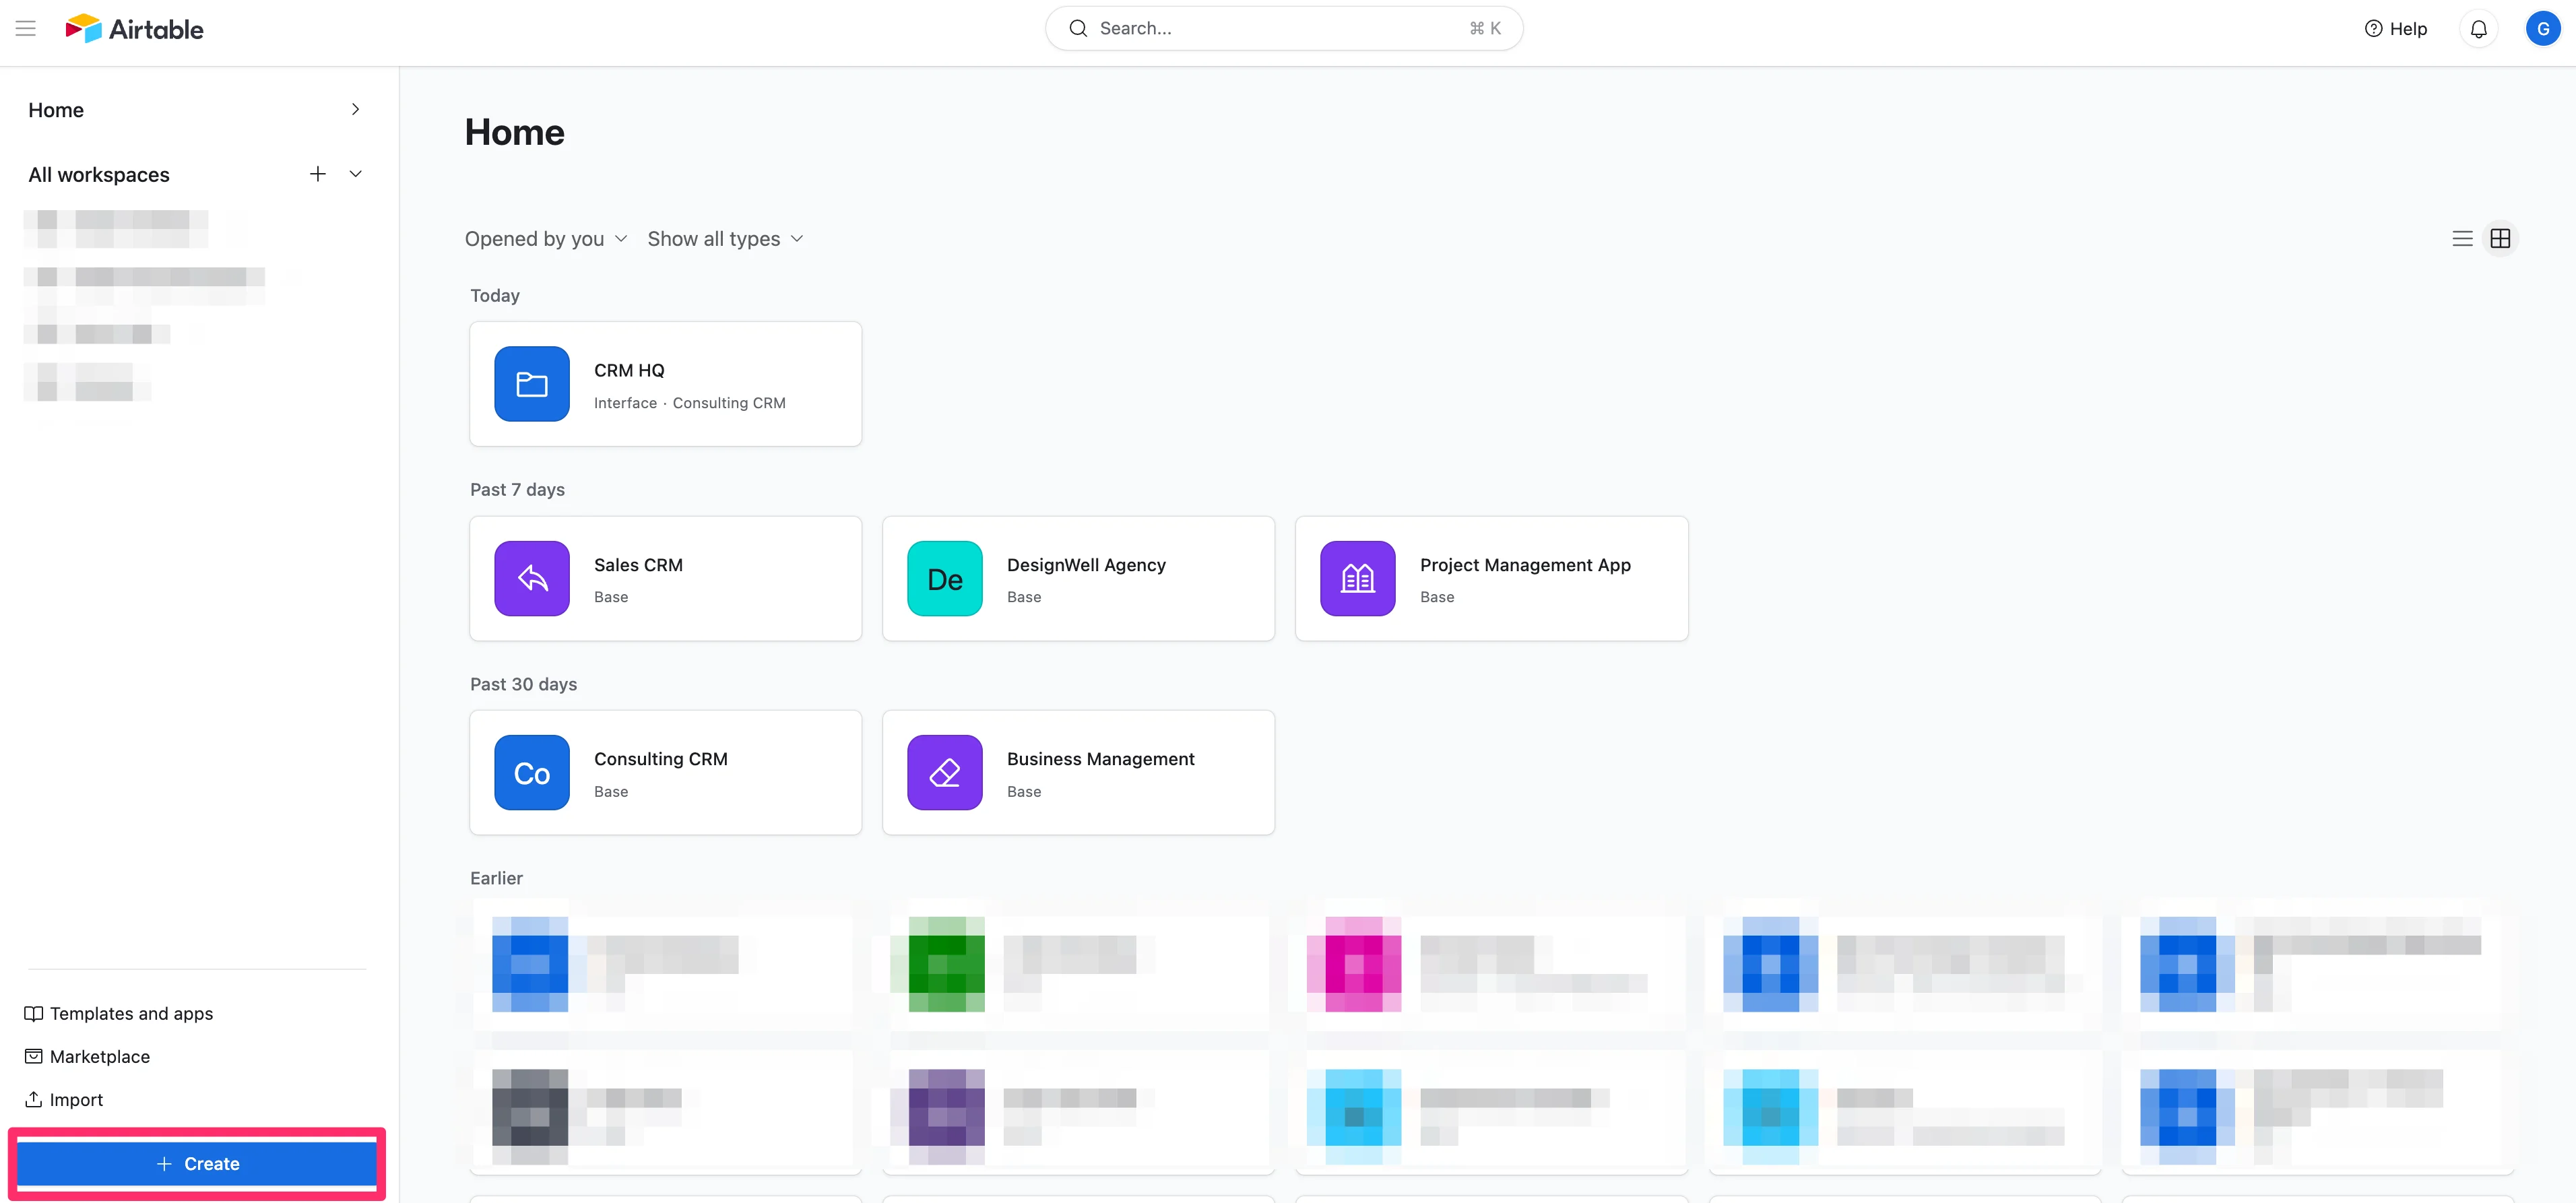
To get started, log in to Airtable and click the “Create” button to create a new base.
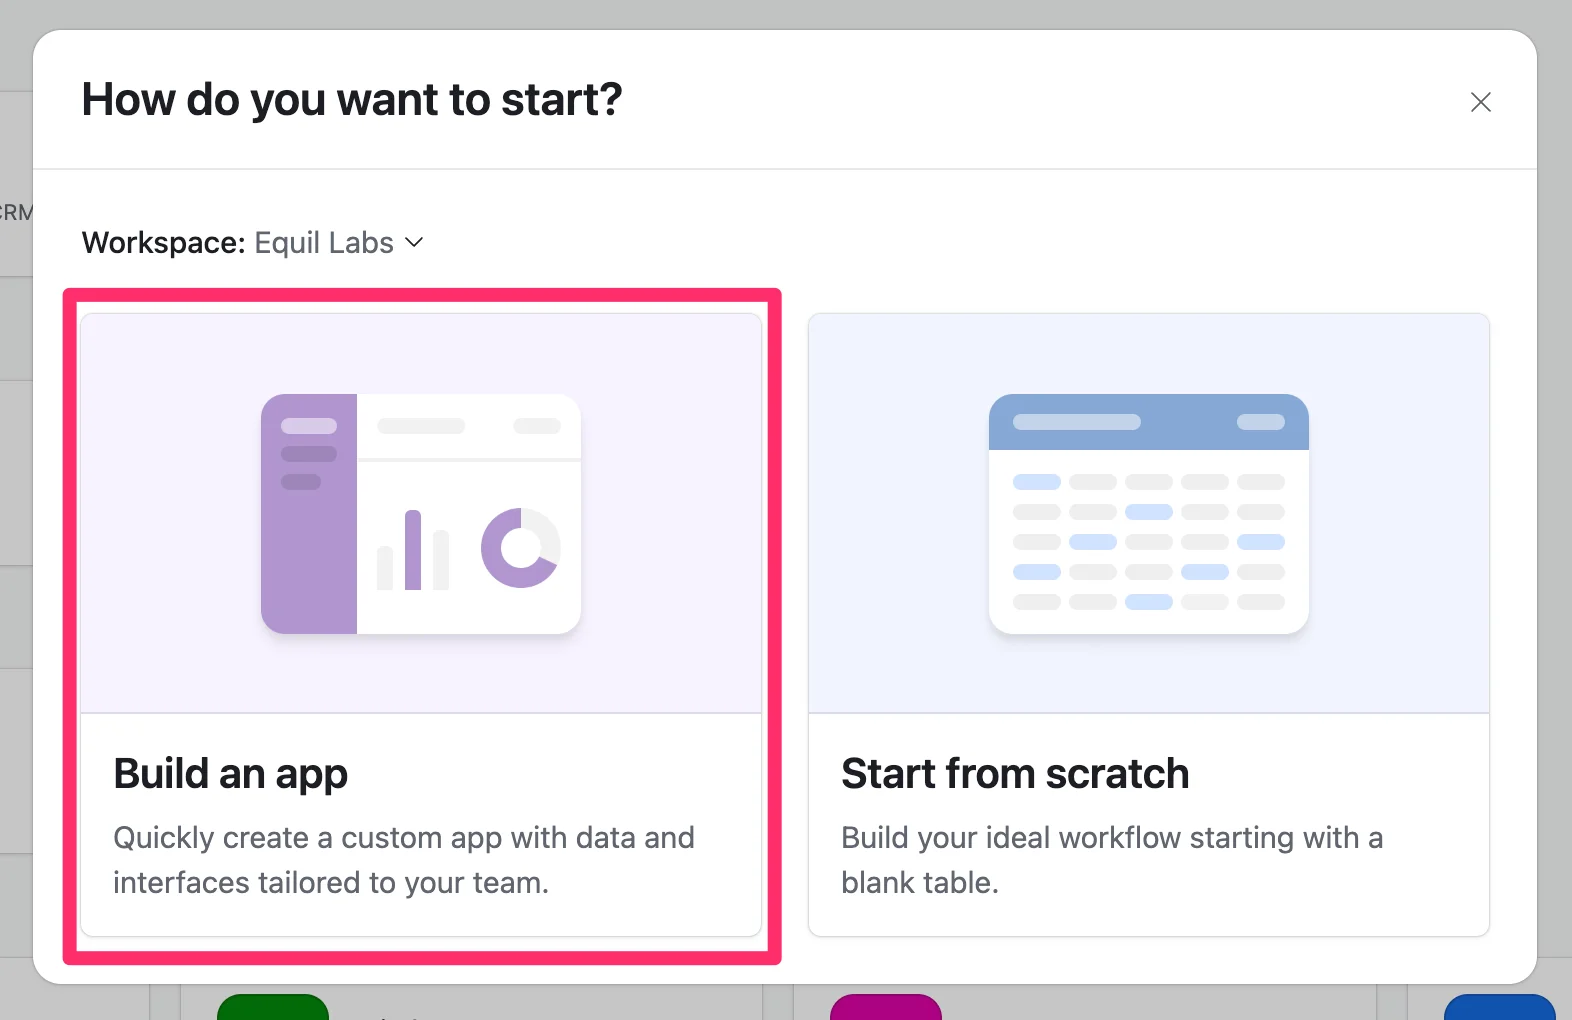
Then, select the “Build an app” option, which will leverage Airtable’s AI app builder.
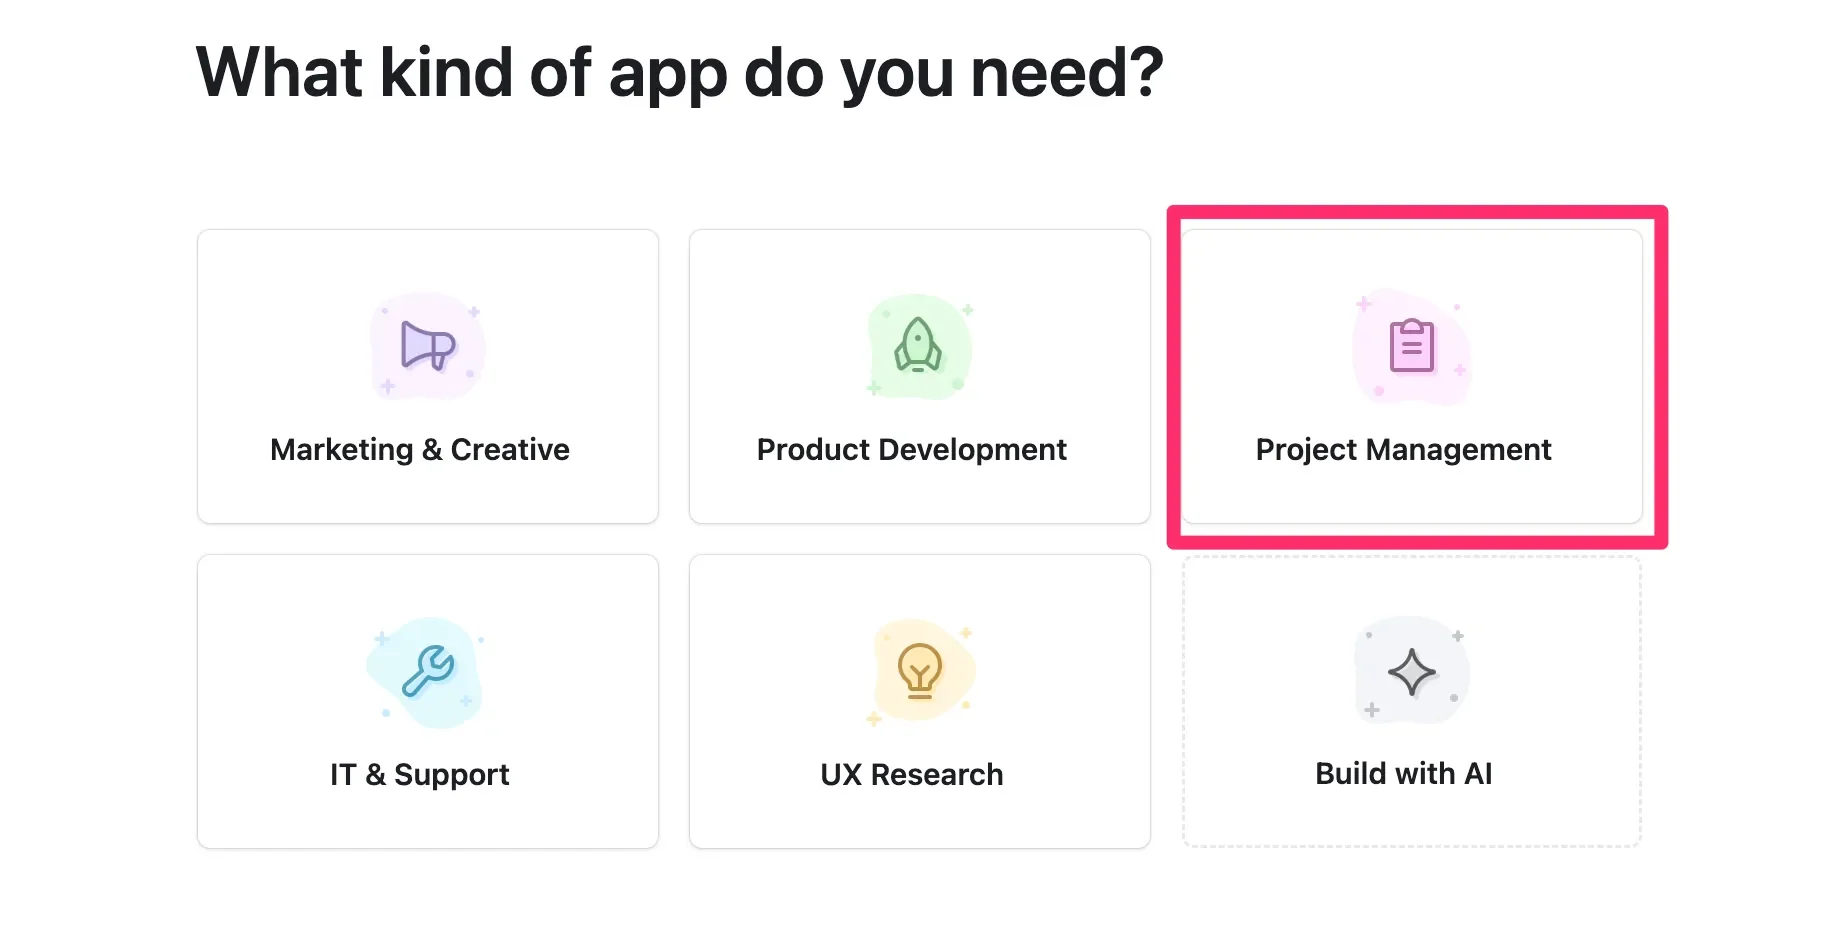
Next, select the “Project Management” option.
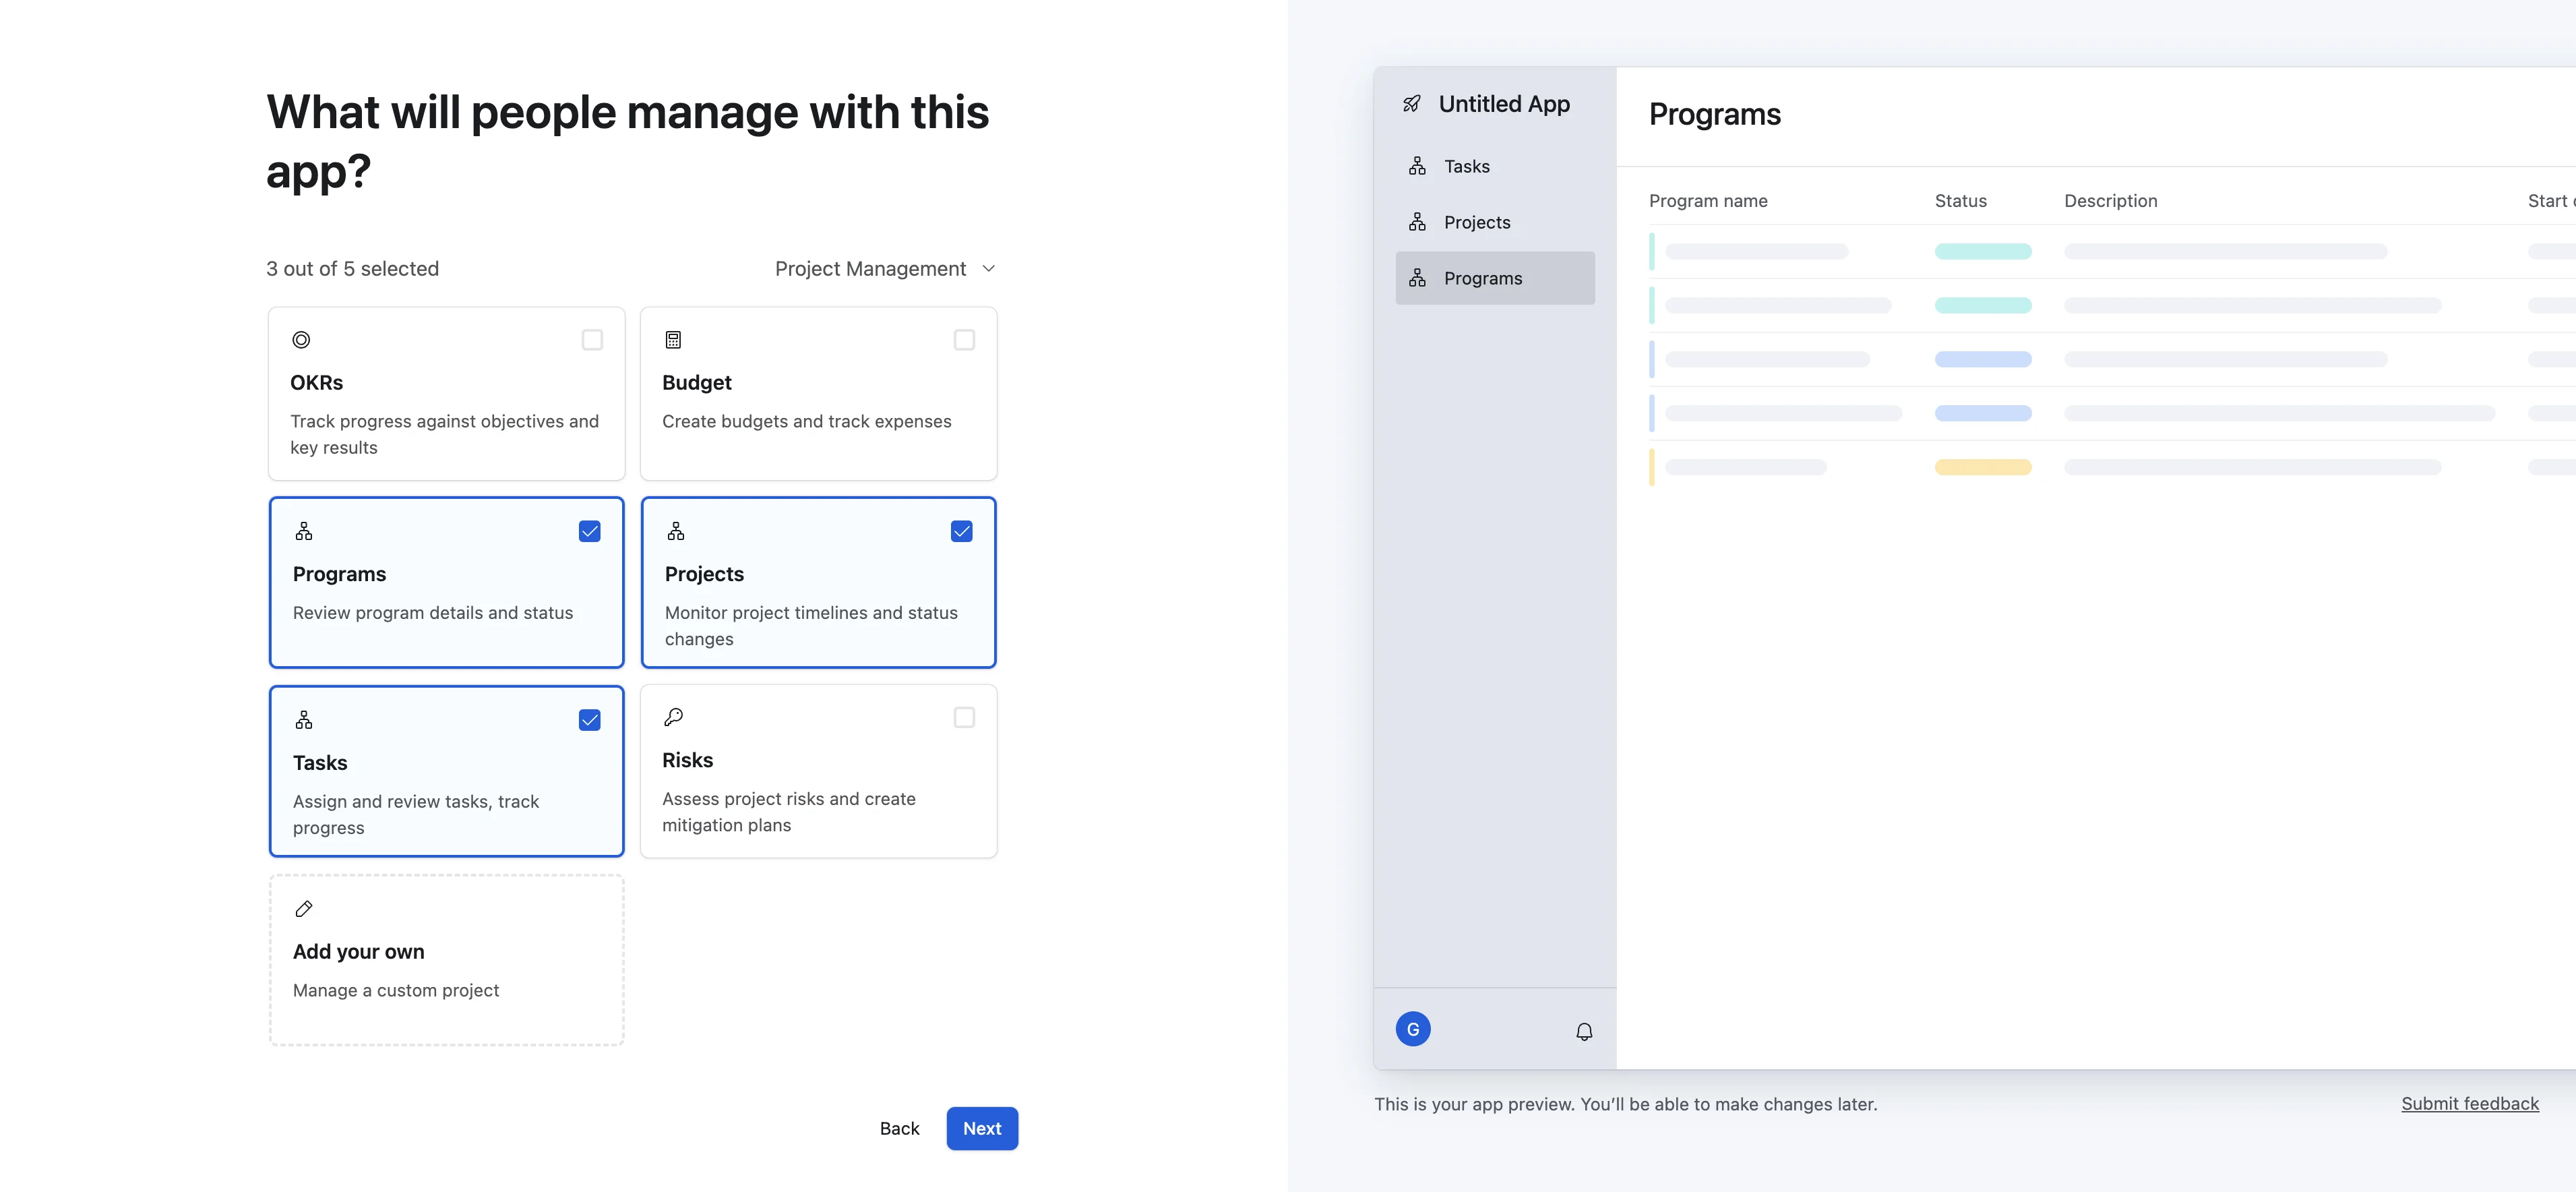
Then, we’ll be able to select the type of data we’ll manage in our application. We’ll start with Programs, Projects, and Tasks for our application.
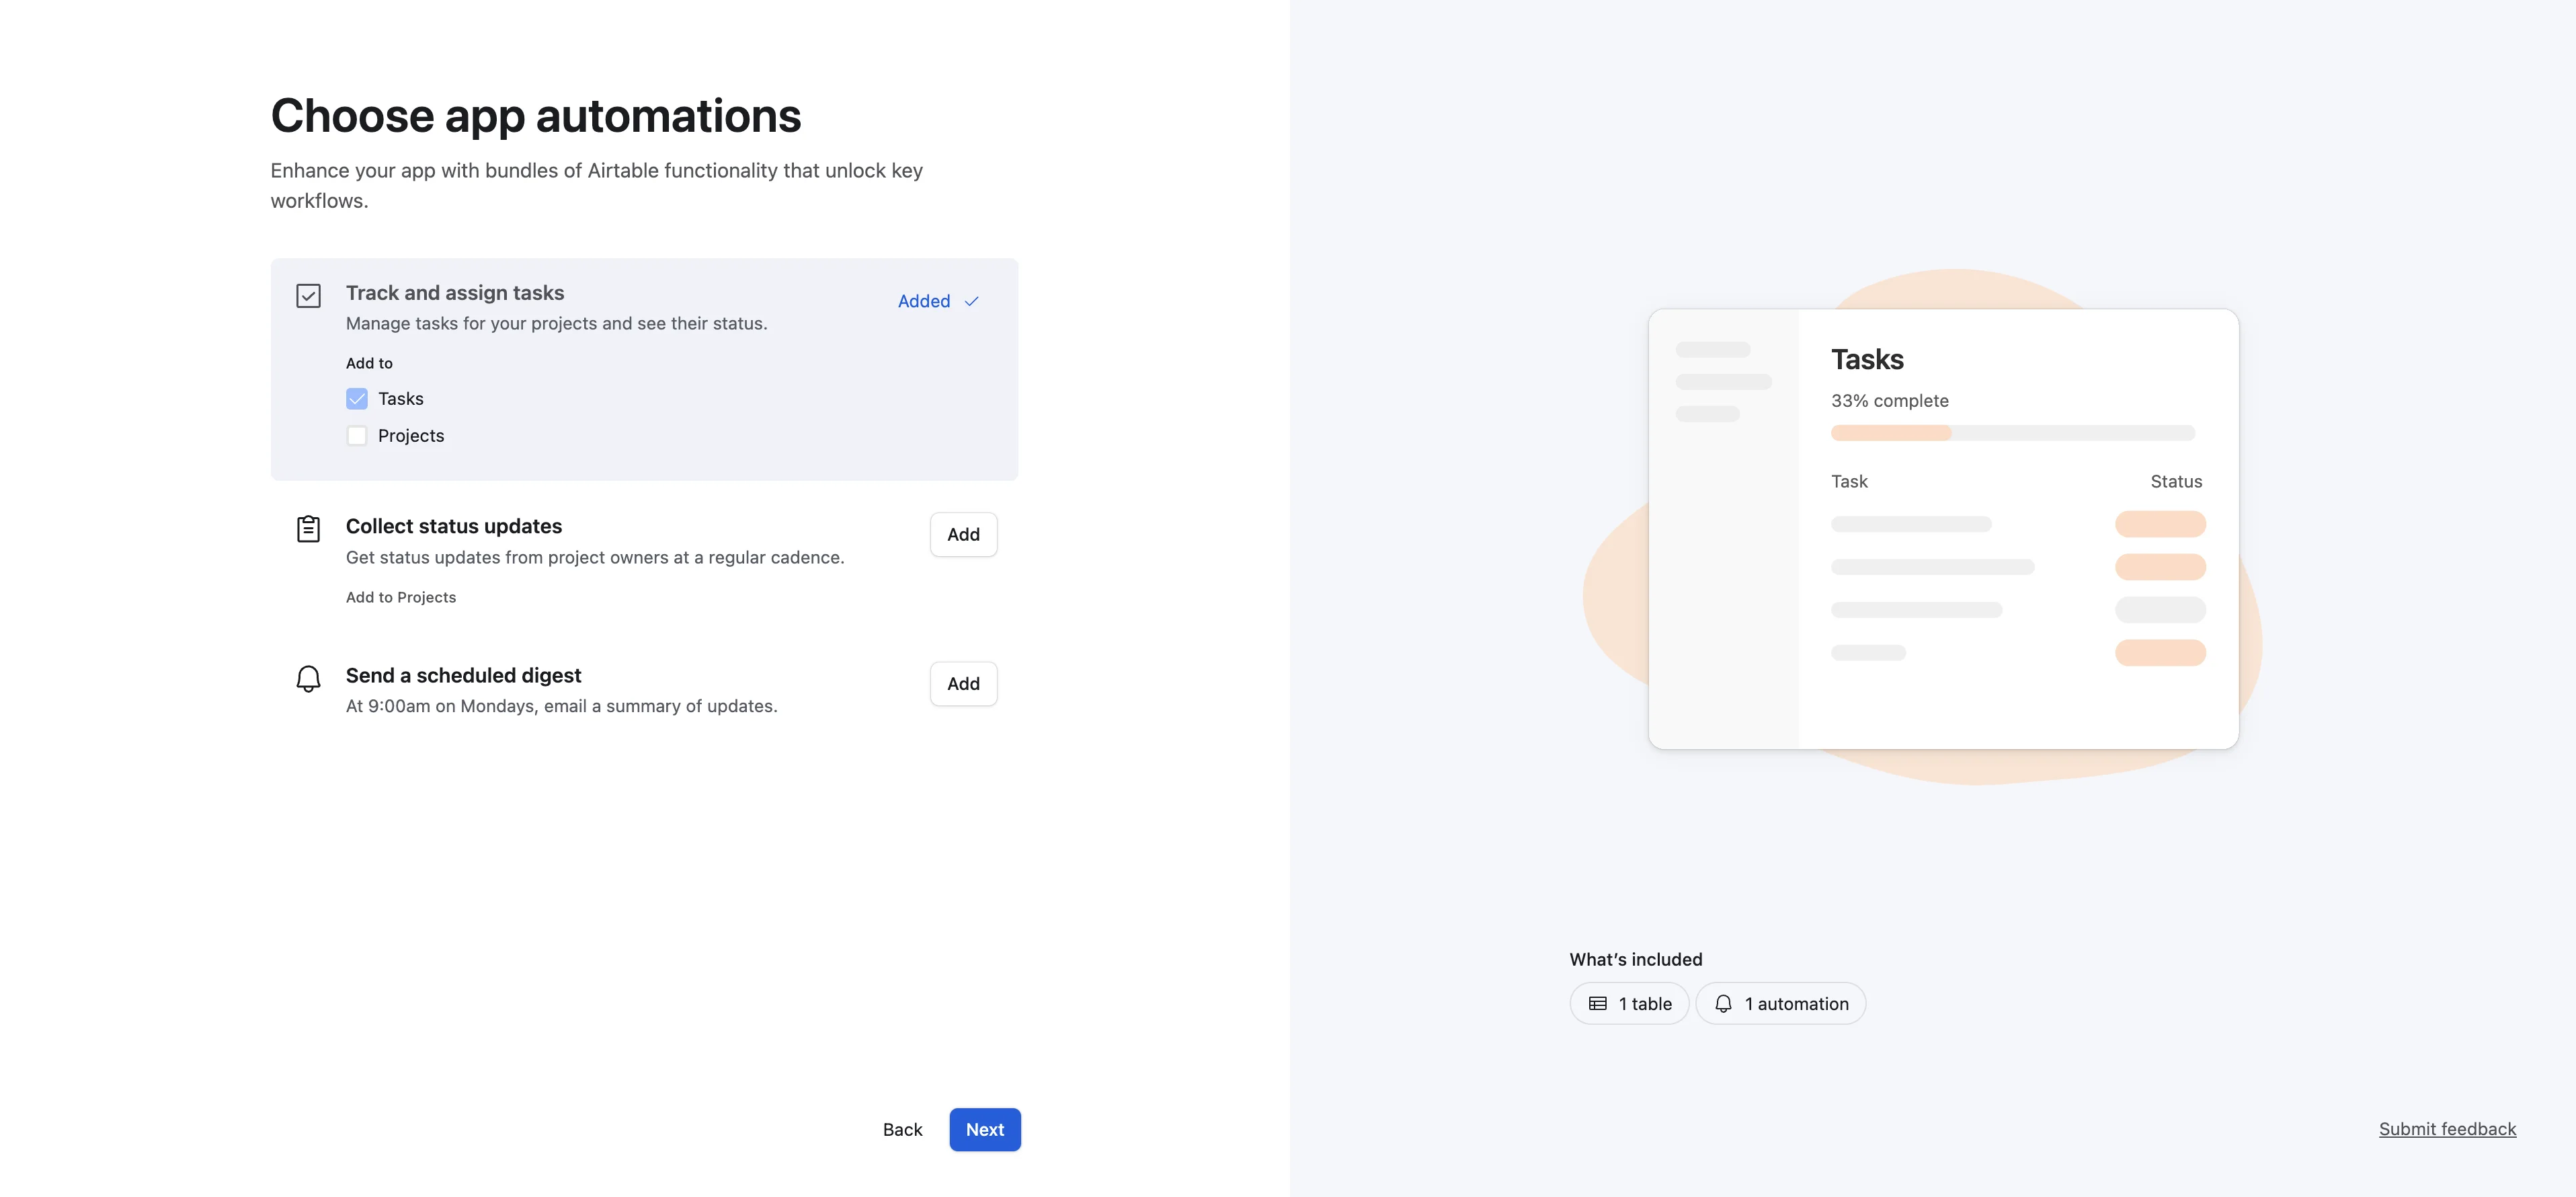
Finally, we can add some out-of-the-box automations to our application. We’ll select the first automation only for now.
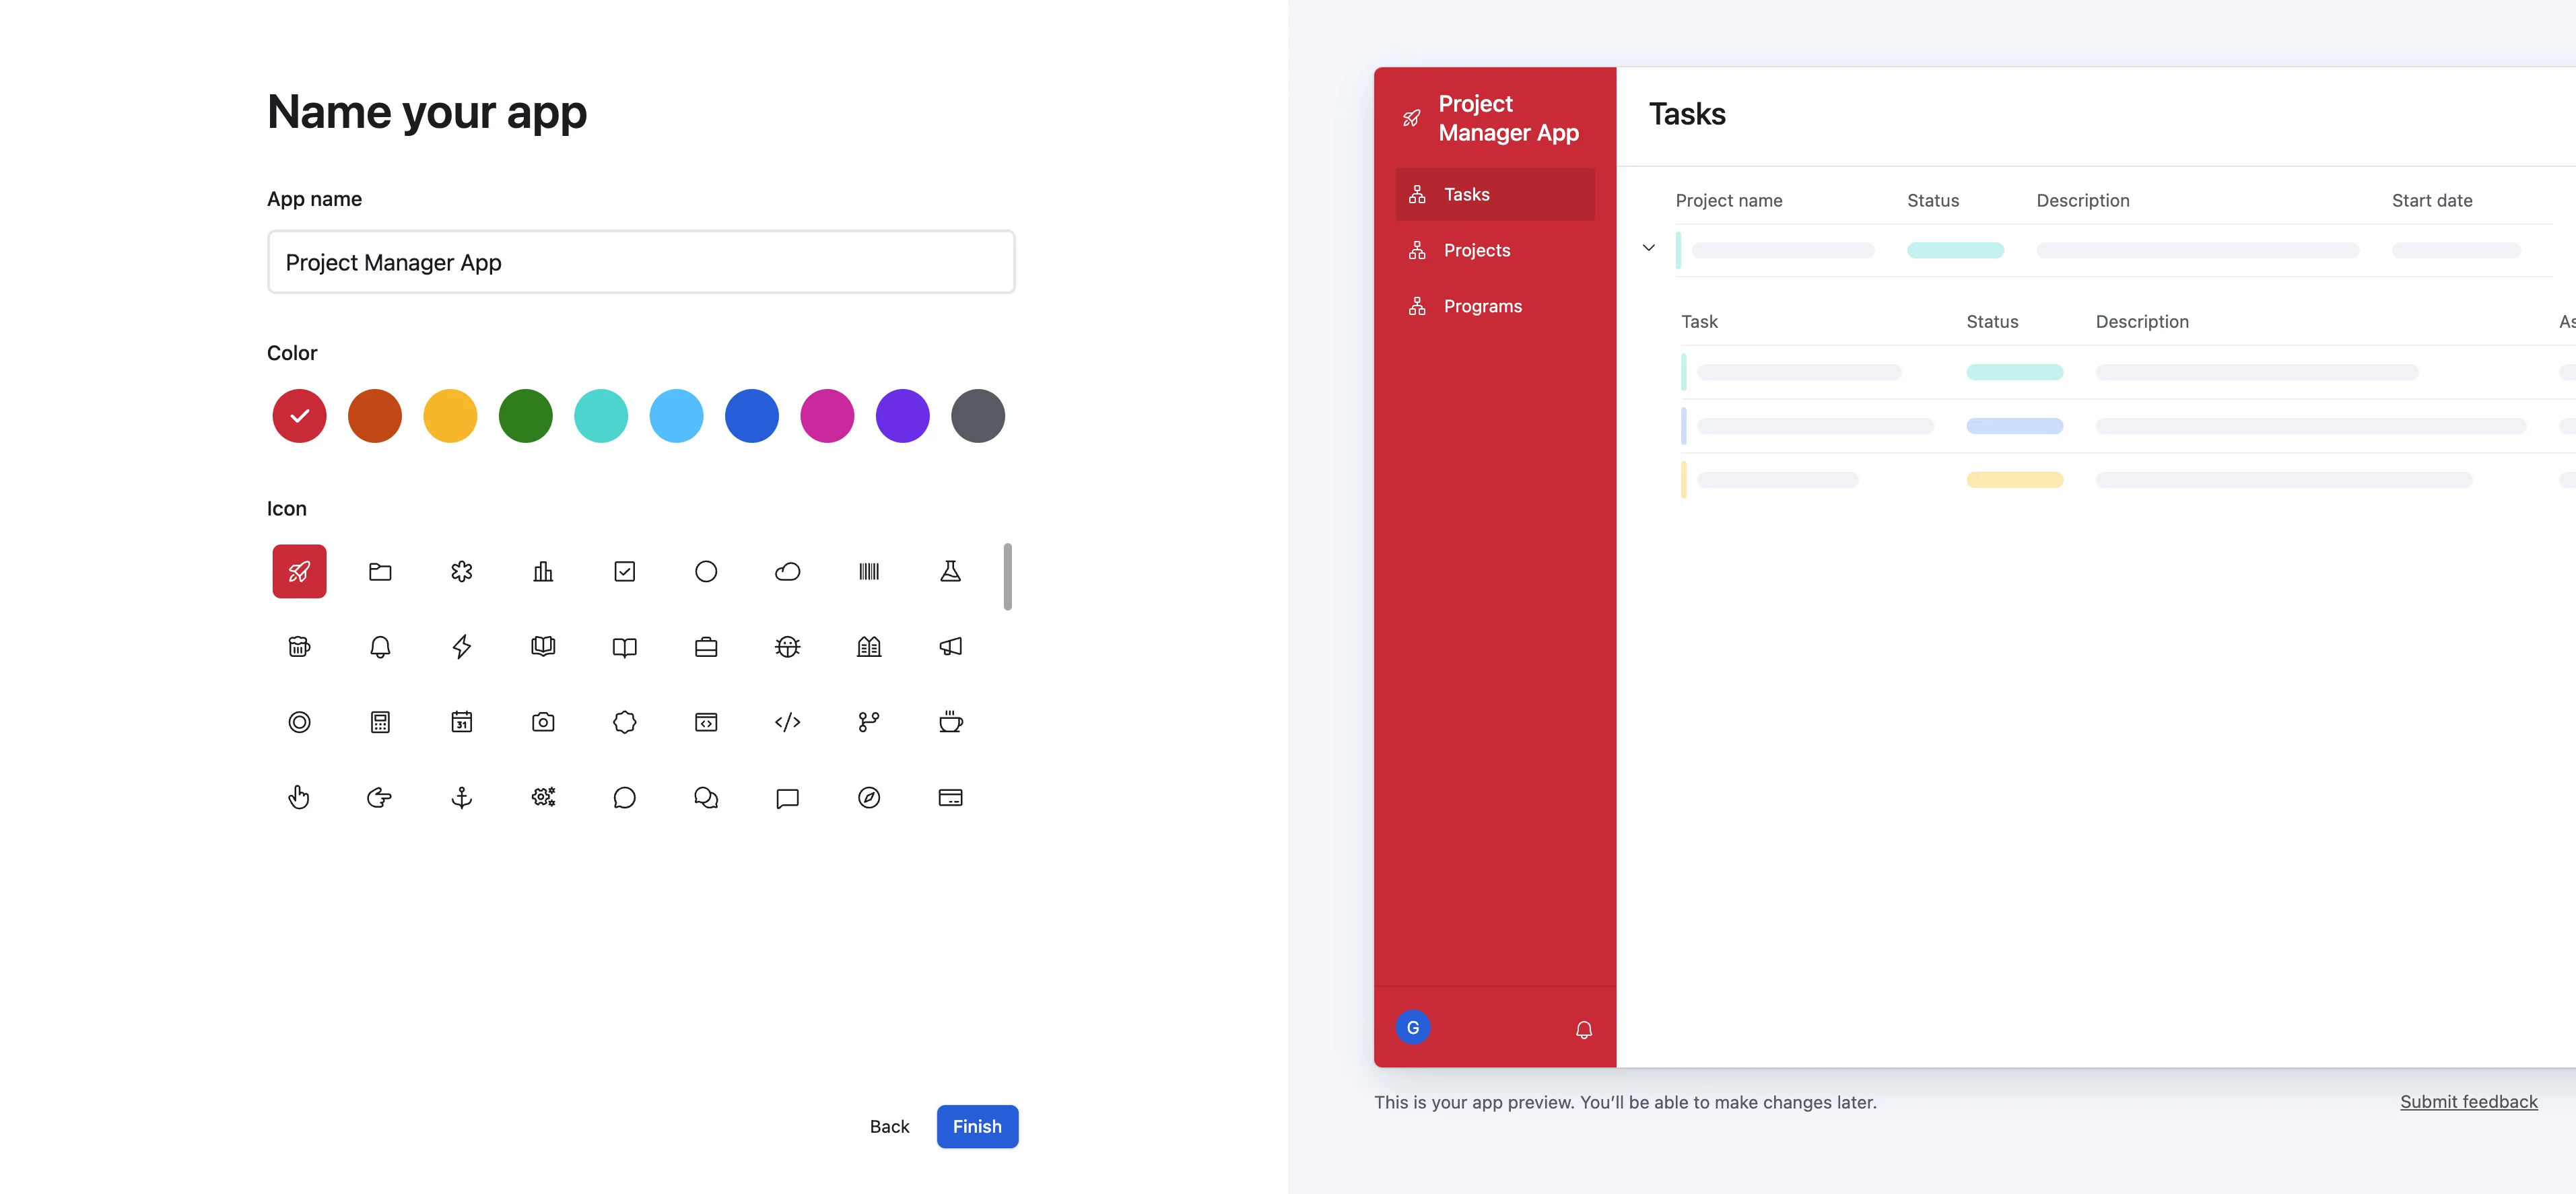
Lastly, we’ll name and choose a color and branding for our application.
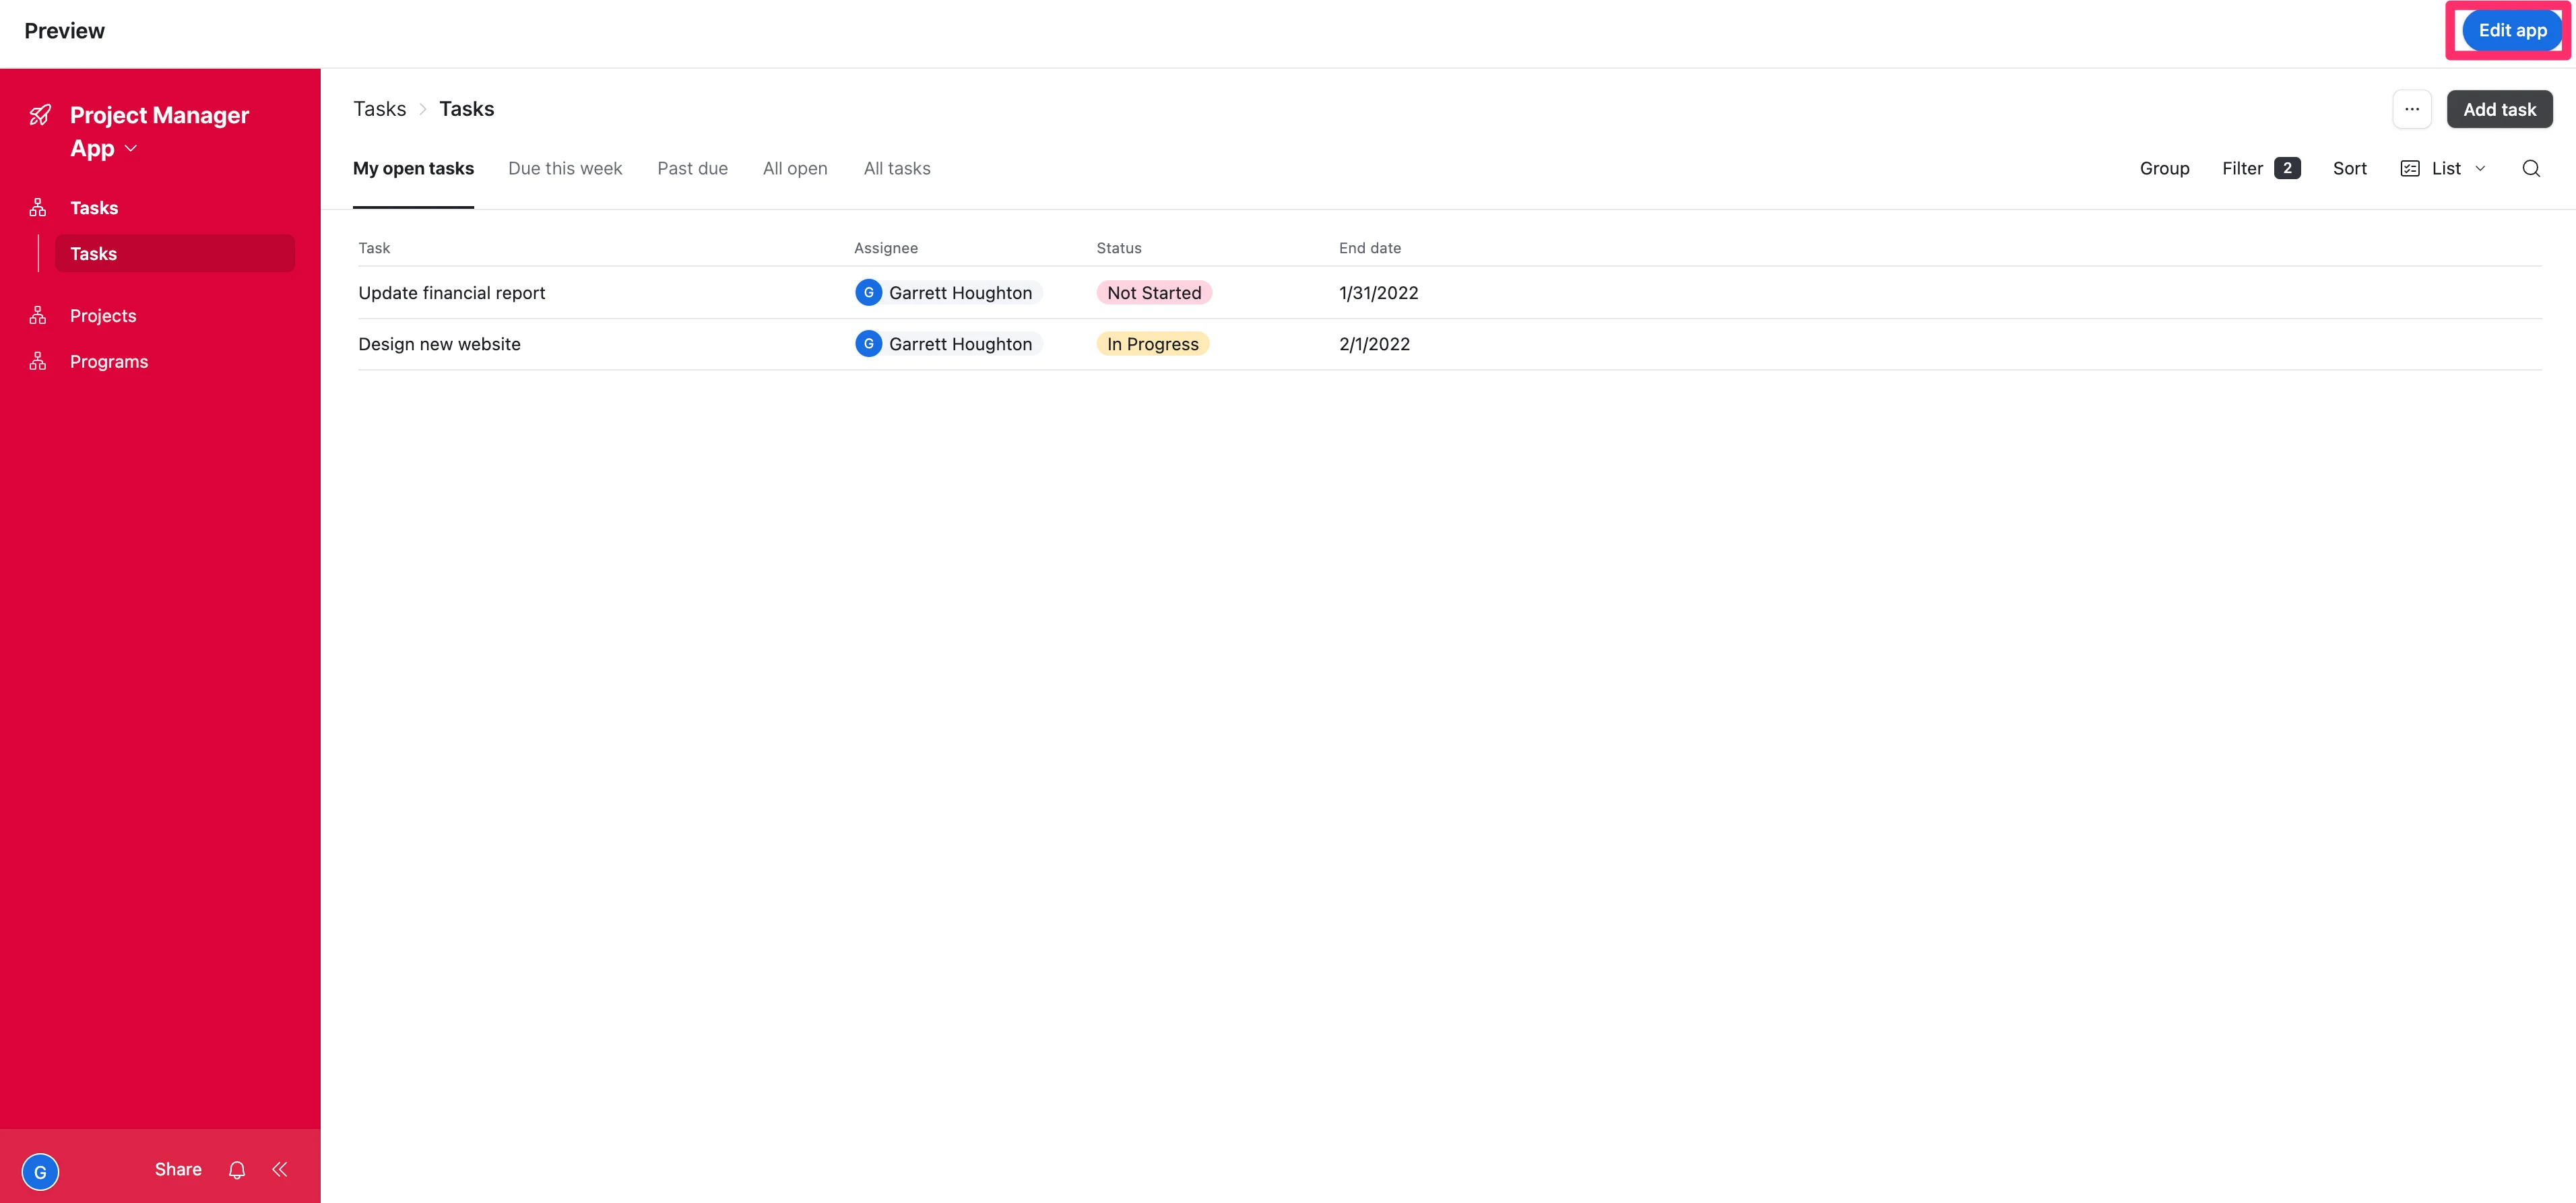
And voila! Just like that, you’ll have a full project management internal application shell built for your program. We want to upload our project plan data next, so we’ll need to get to the data layer of the application. To do this, click the “Edit app” button in the top right corner of the page.
Upload your project plan data
In this edit view of the app, click the “Data” tab in the top navigation.
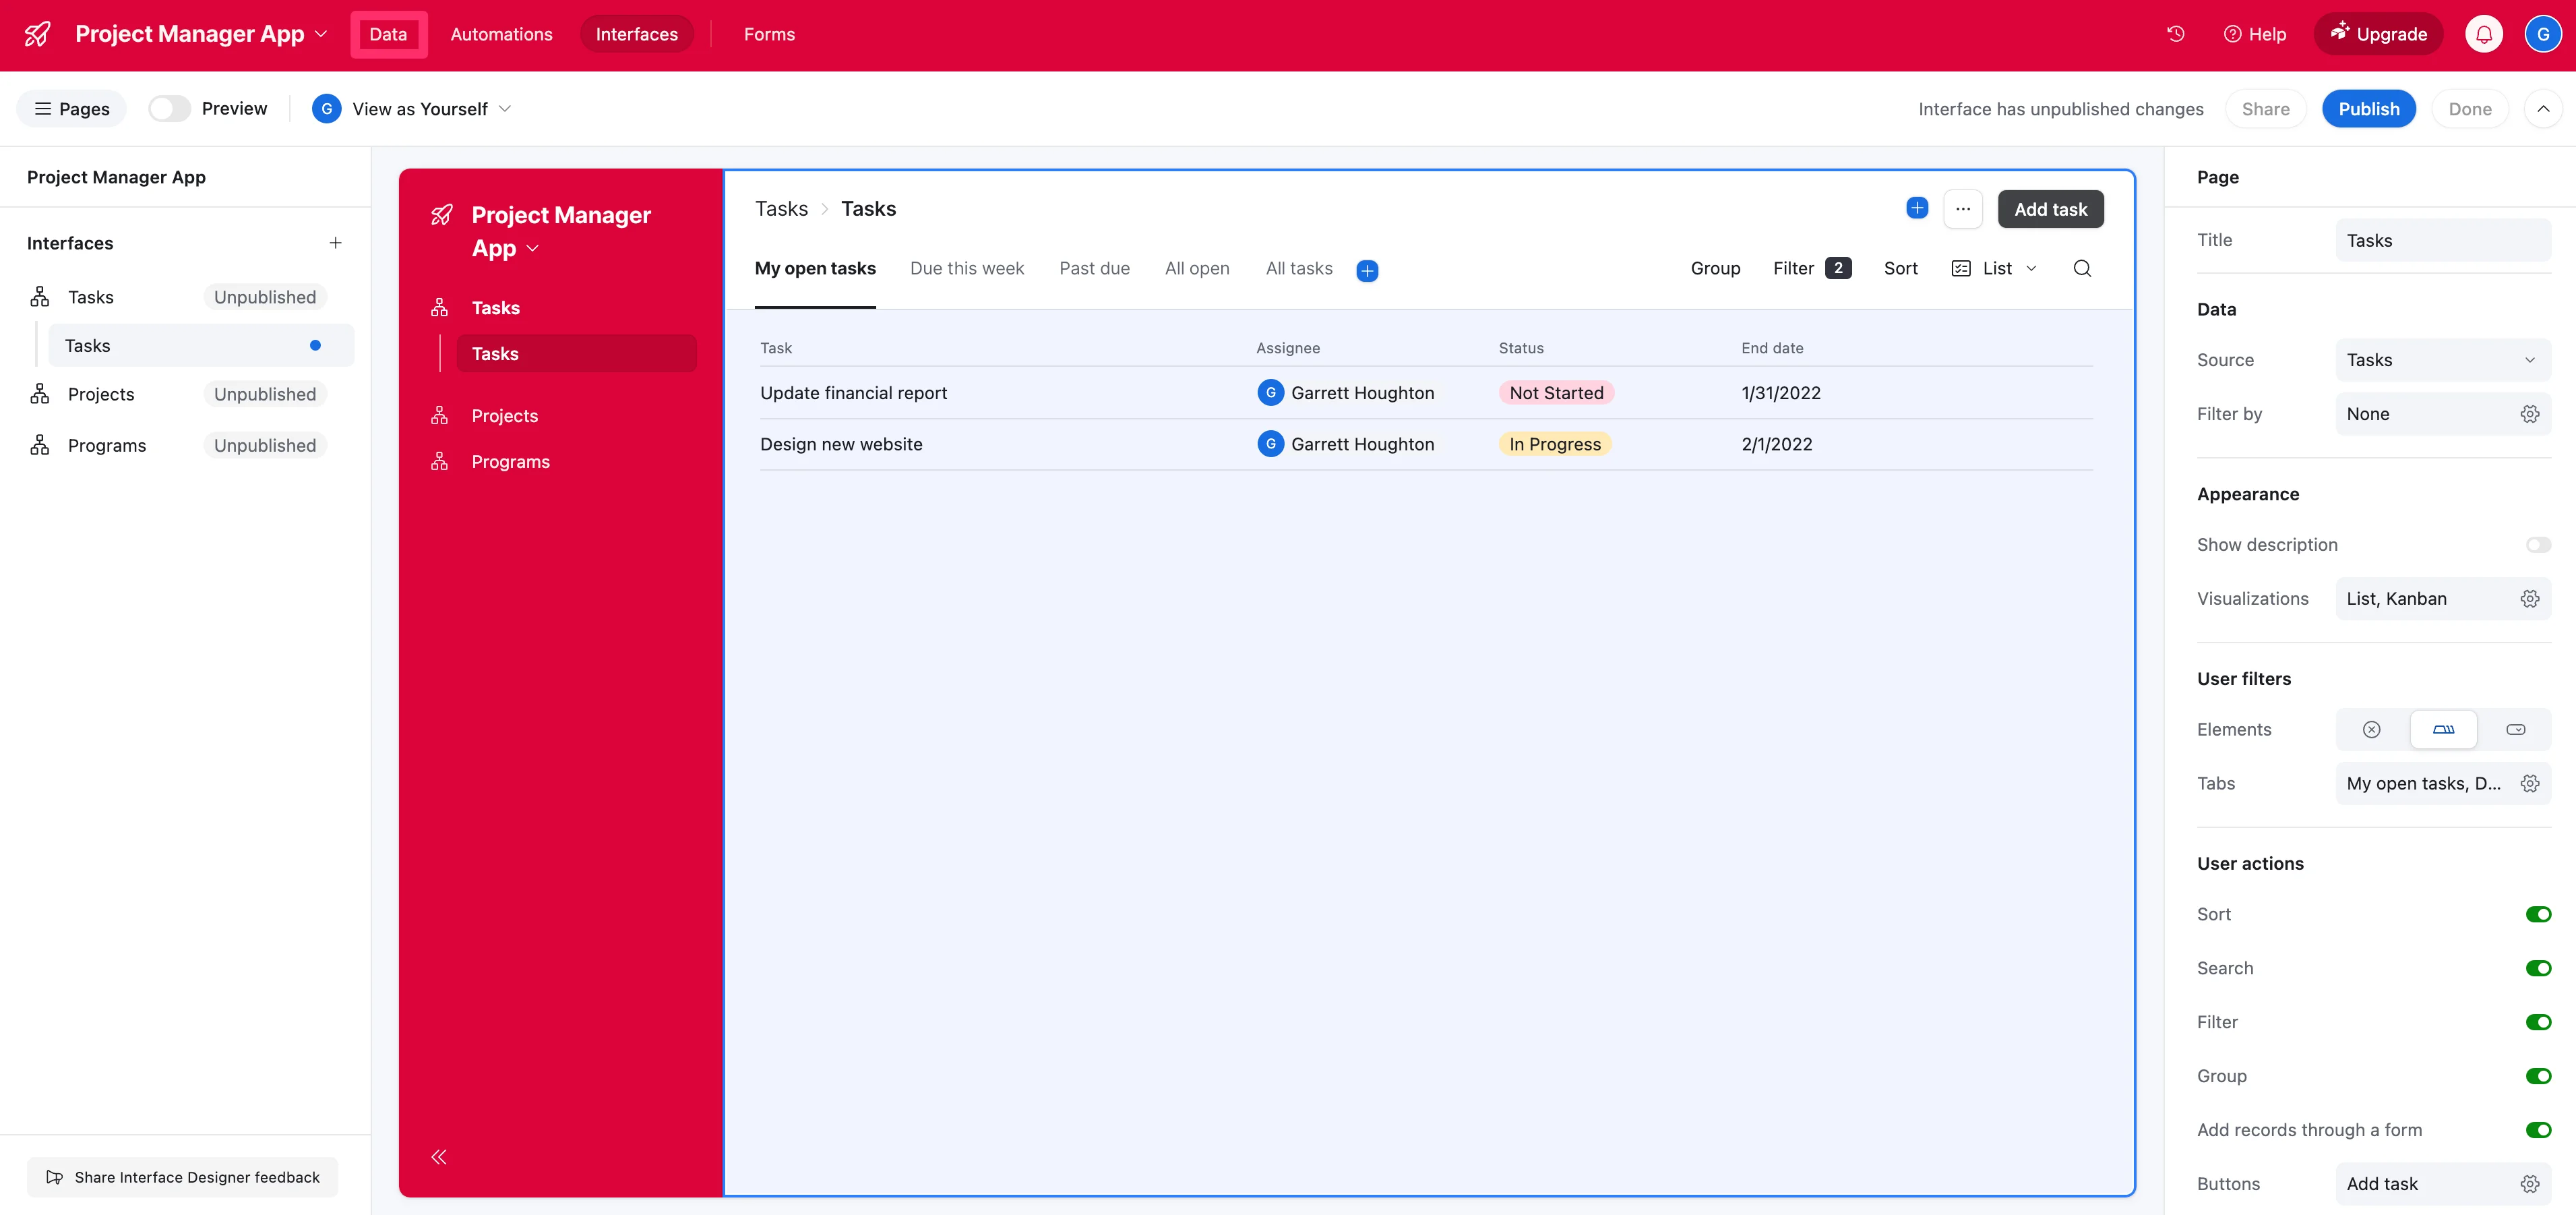
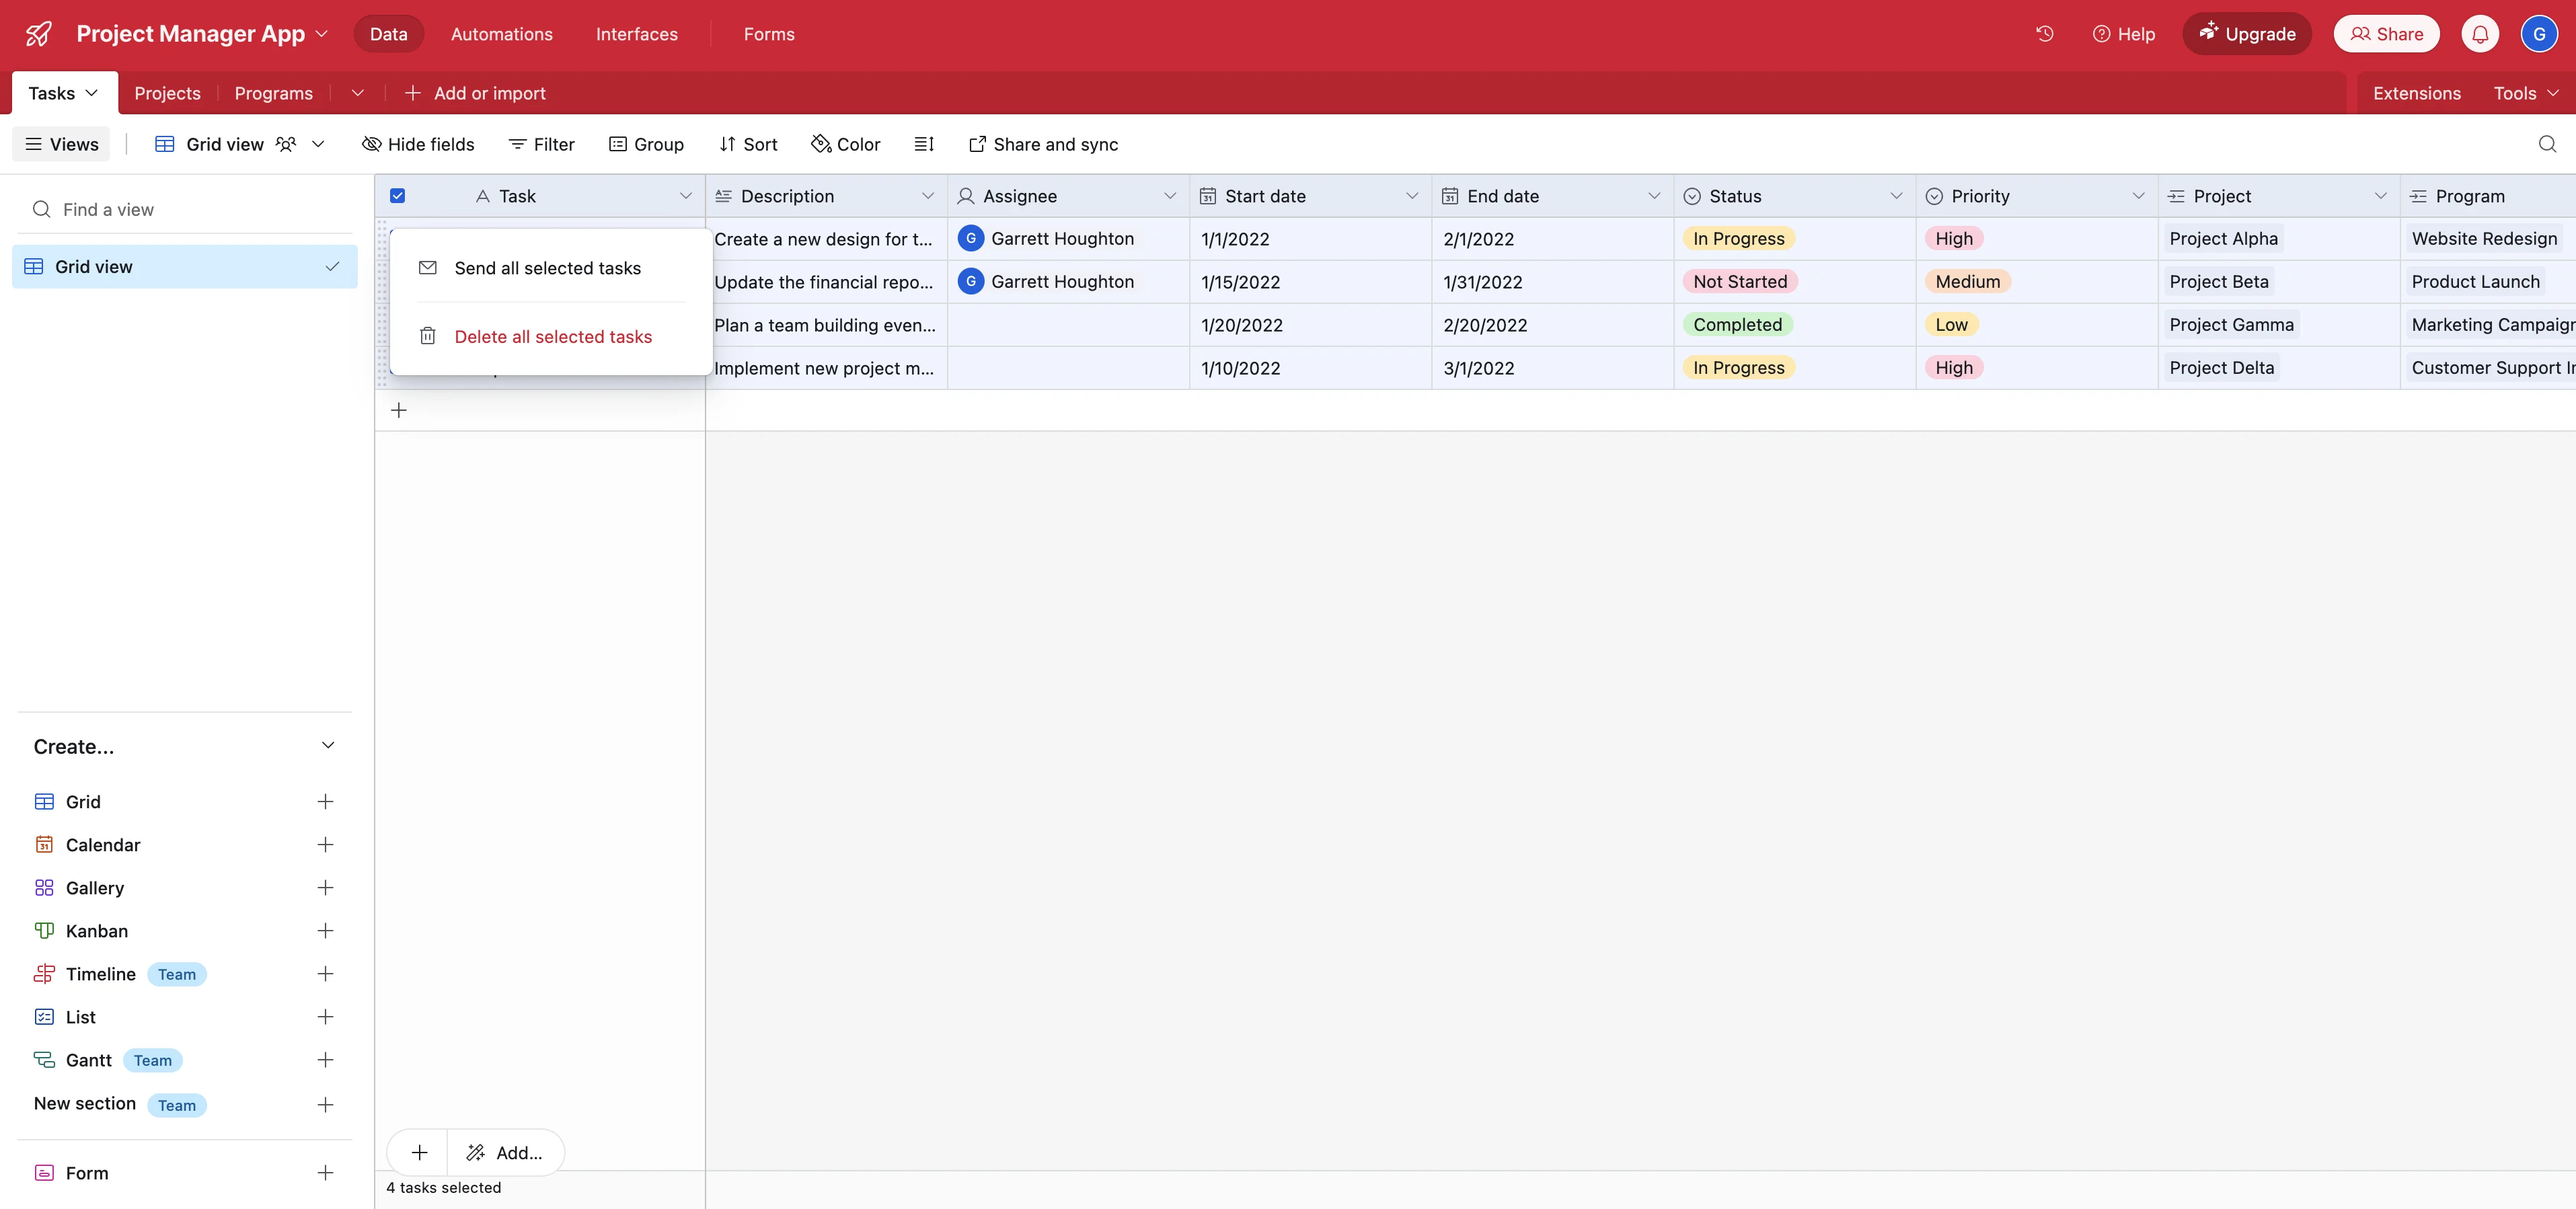
There will be data tables for Tasks, Projects, and Programs. All of the data from our project plan from the previous lesson is at the Task level, so we’ll work in this “Tasks” data table exclusively.
First, we’ll delete all of the existing data by clicking the checkbox in the top-left of the table, right-clicking on the rows, and selecting the “Delete all selected tasks” option.
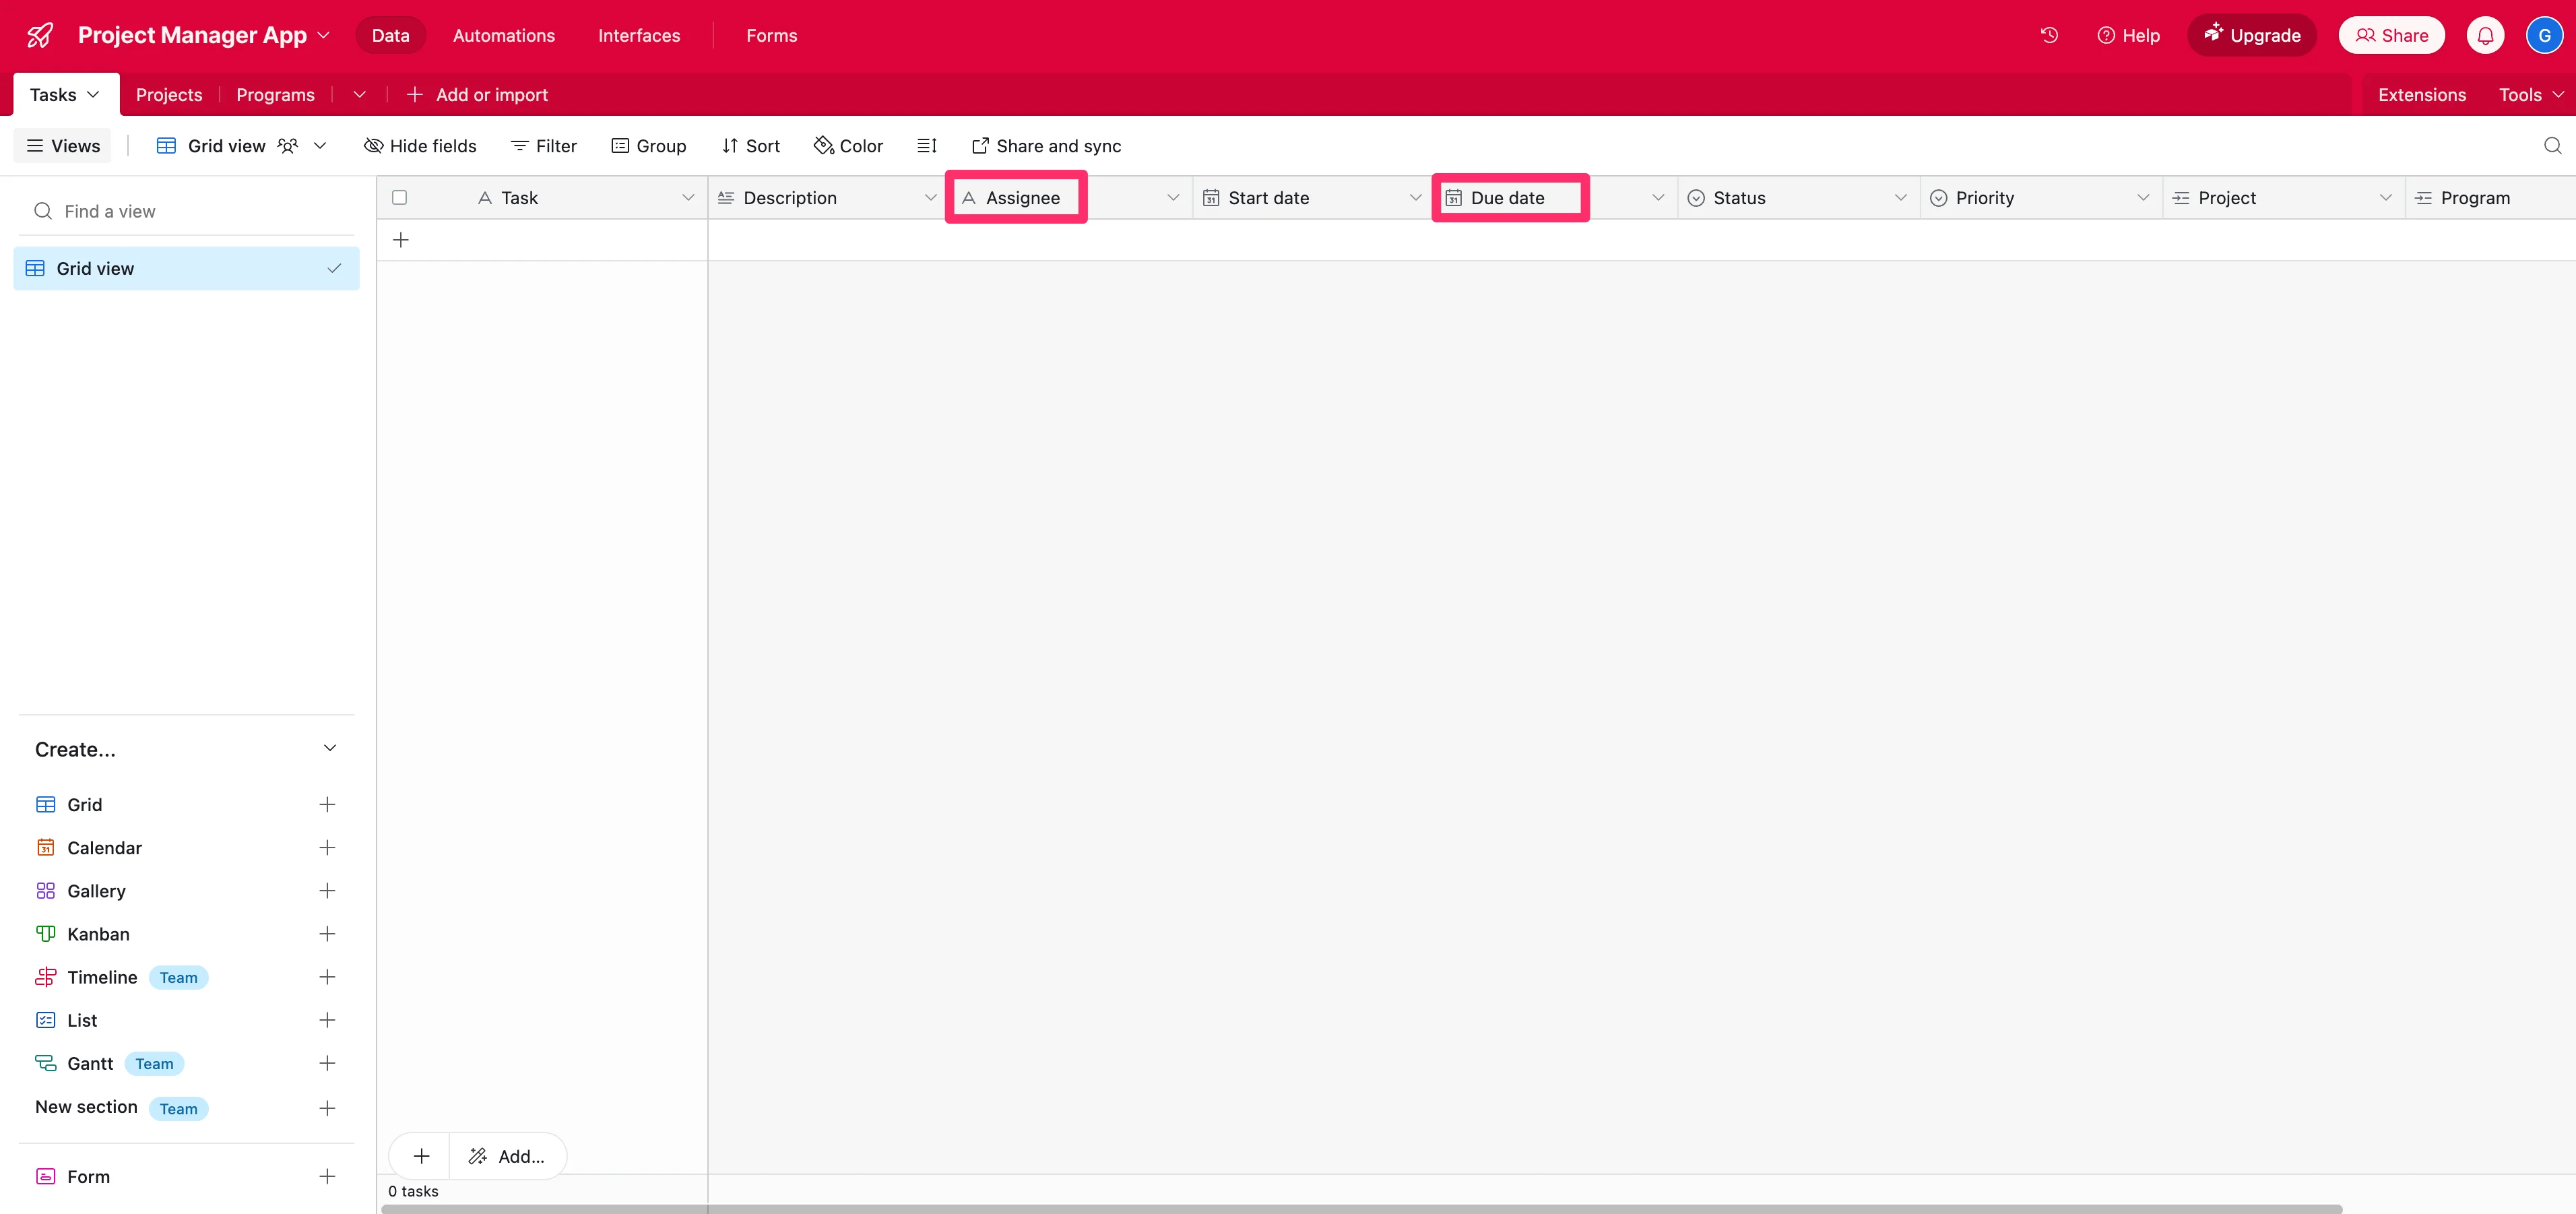
With the data cleared out, we’ll also make some adjustments to the column headers so they match our project plan’s data types and labels. Namely, we’ll change the “Assignee” field to a text field and update “End date” to “Due date”.
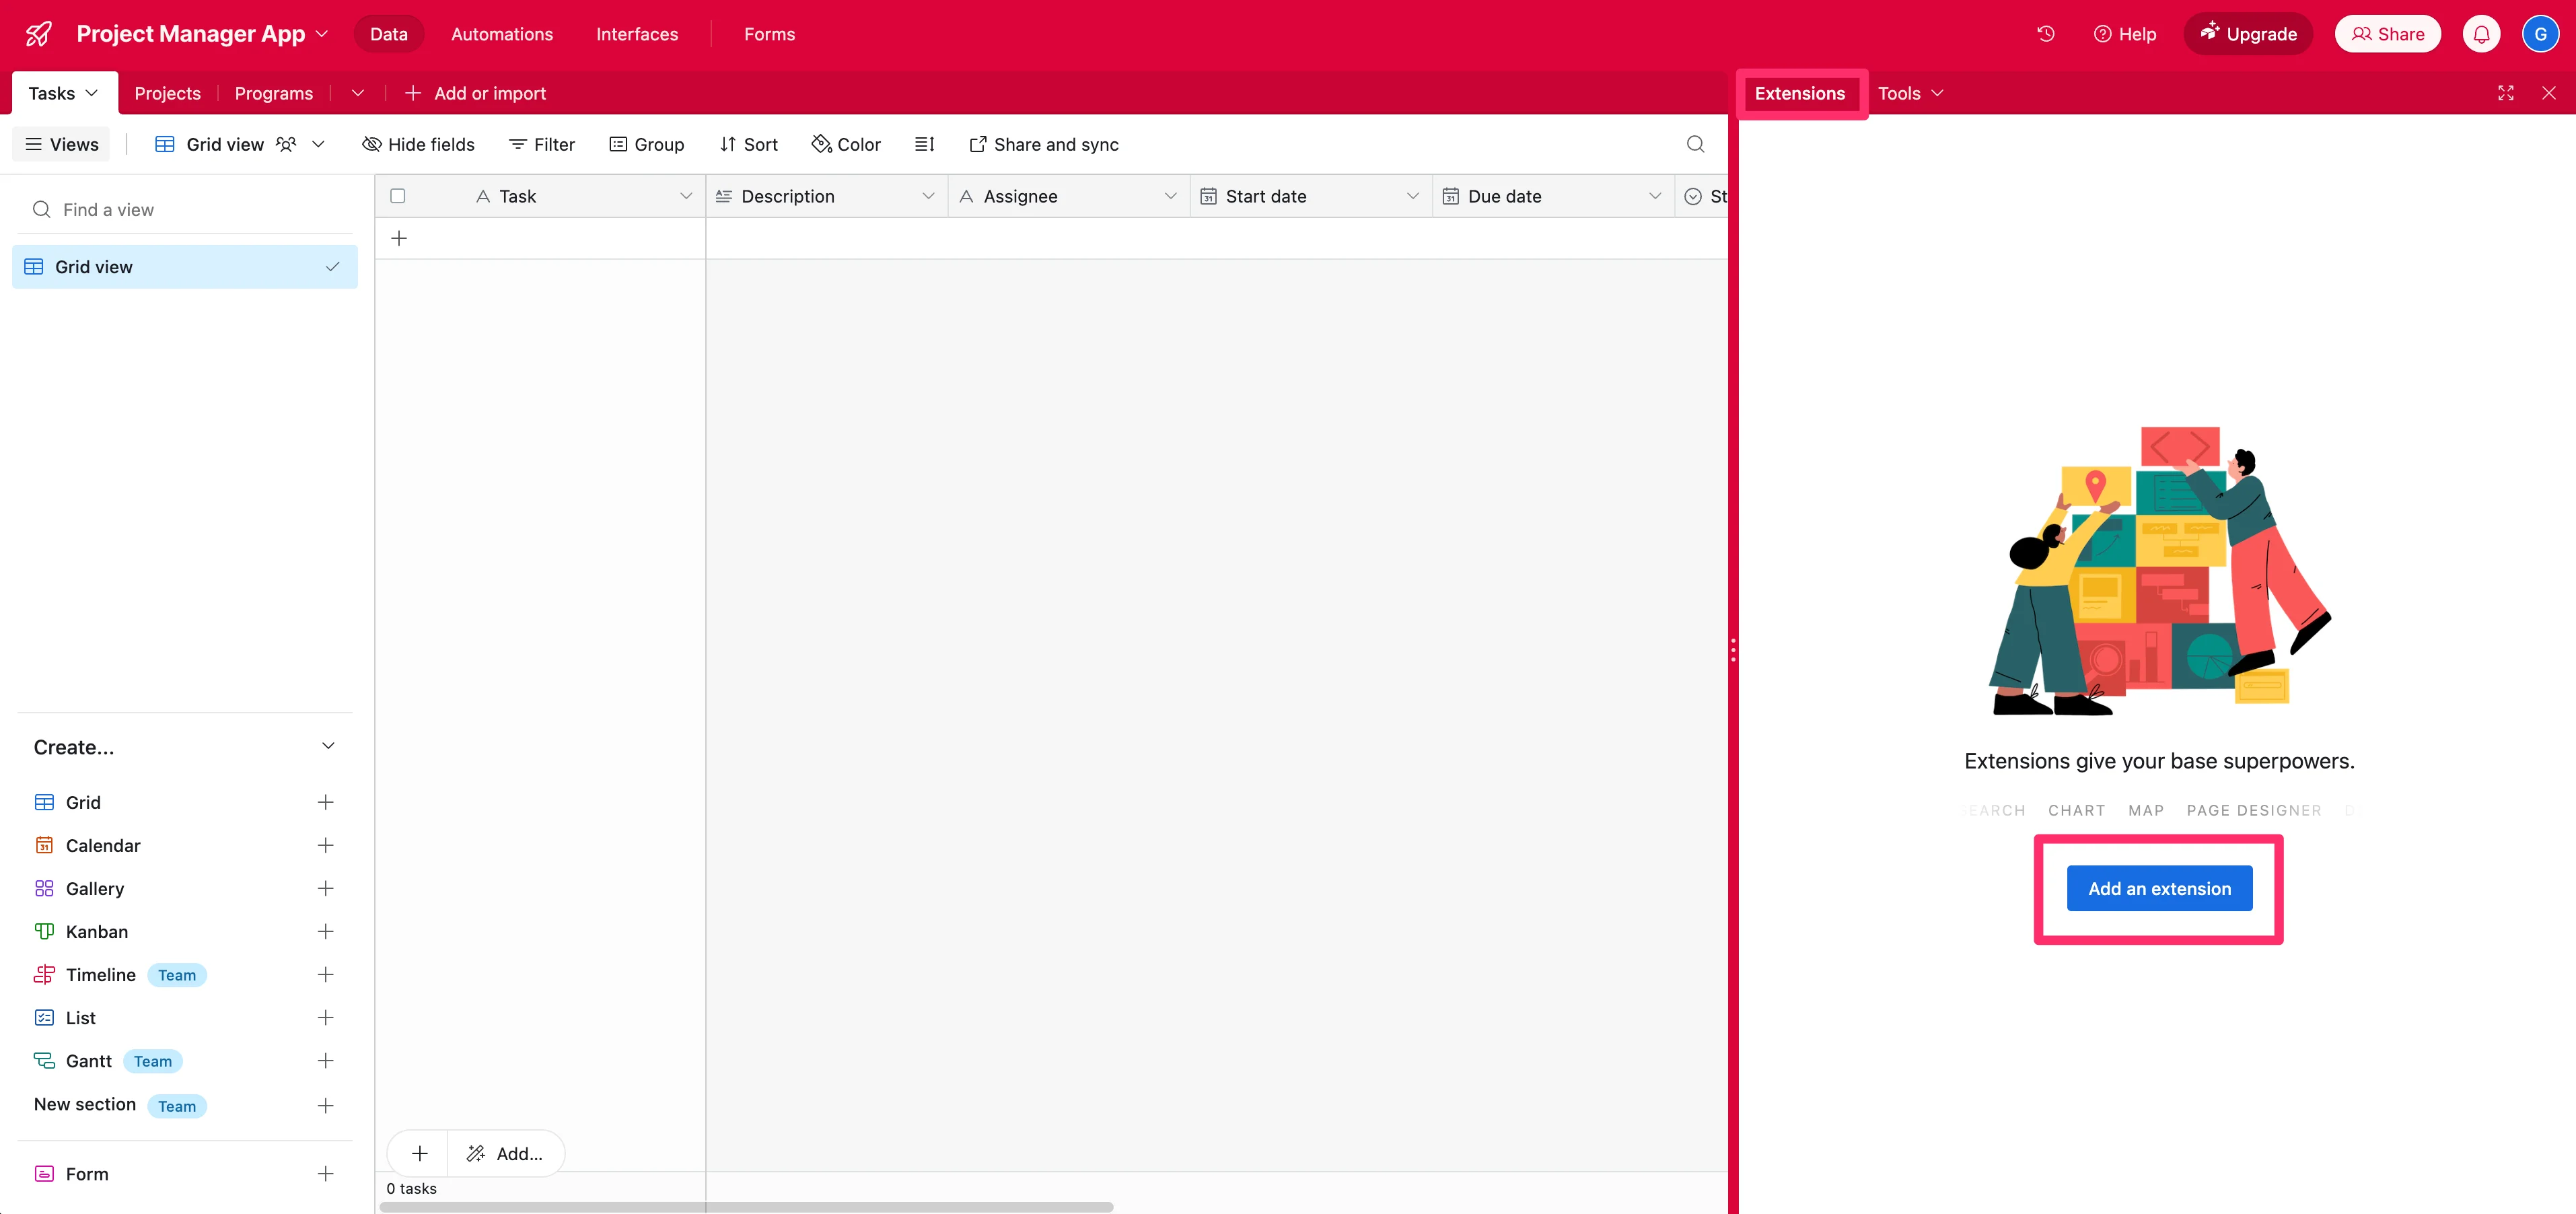
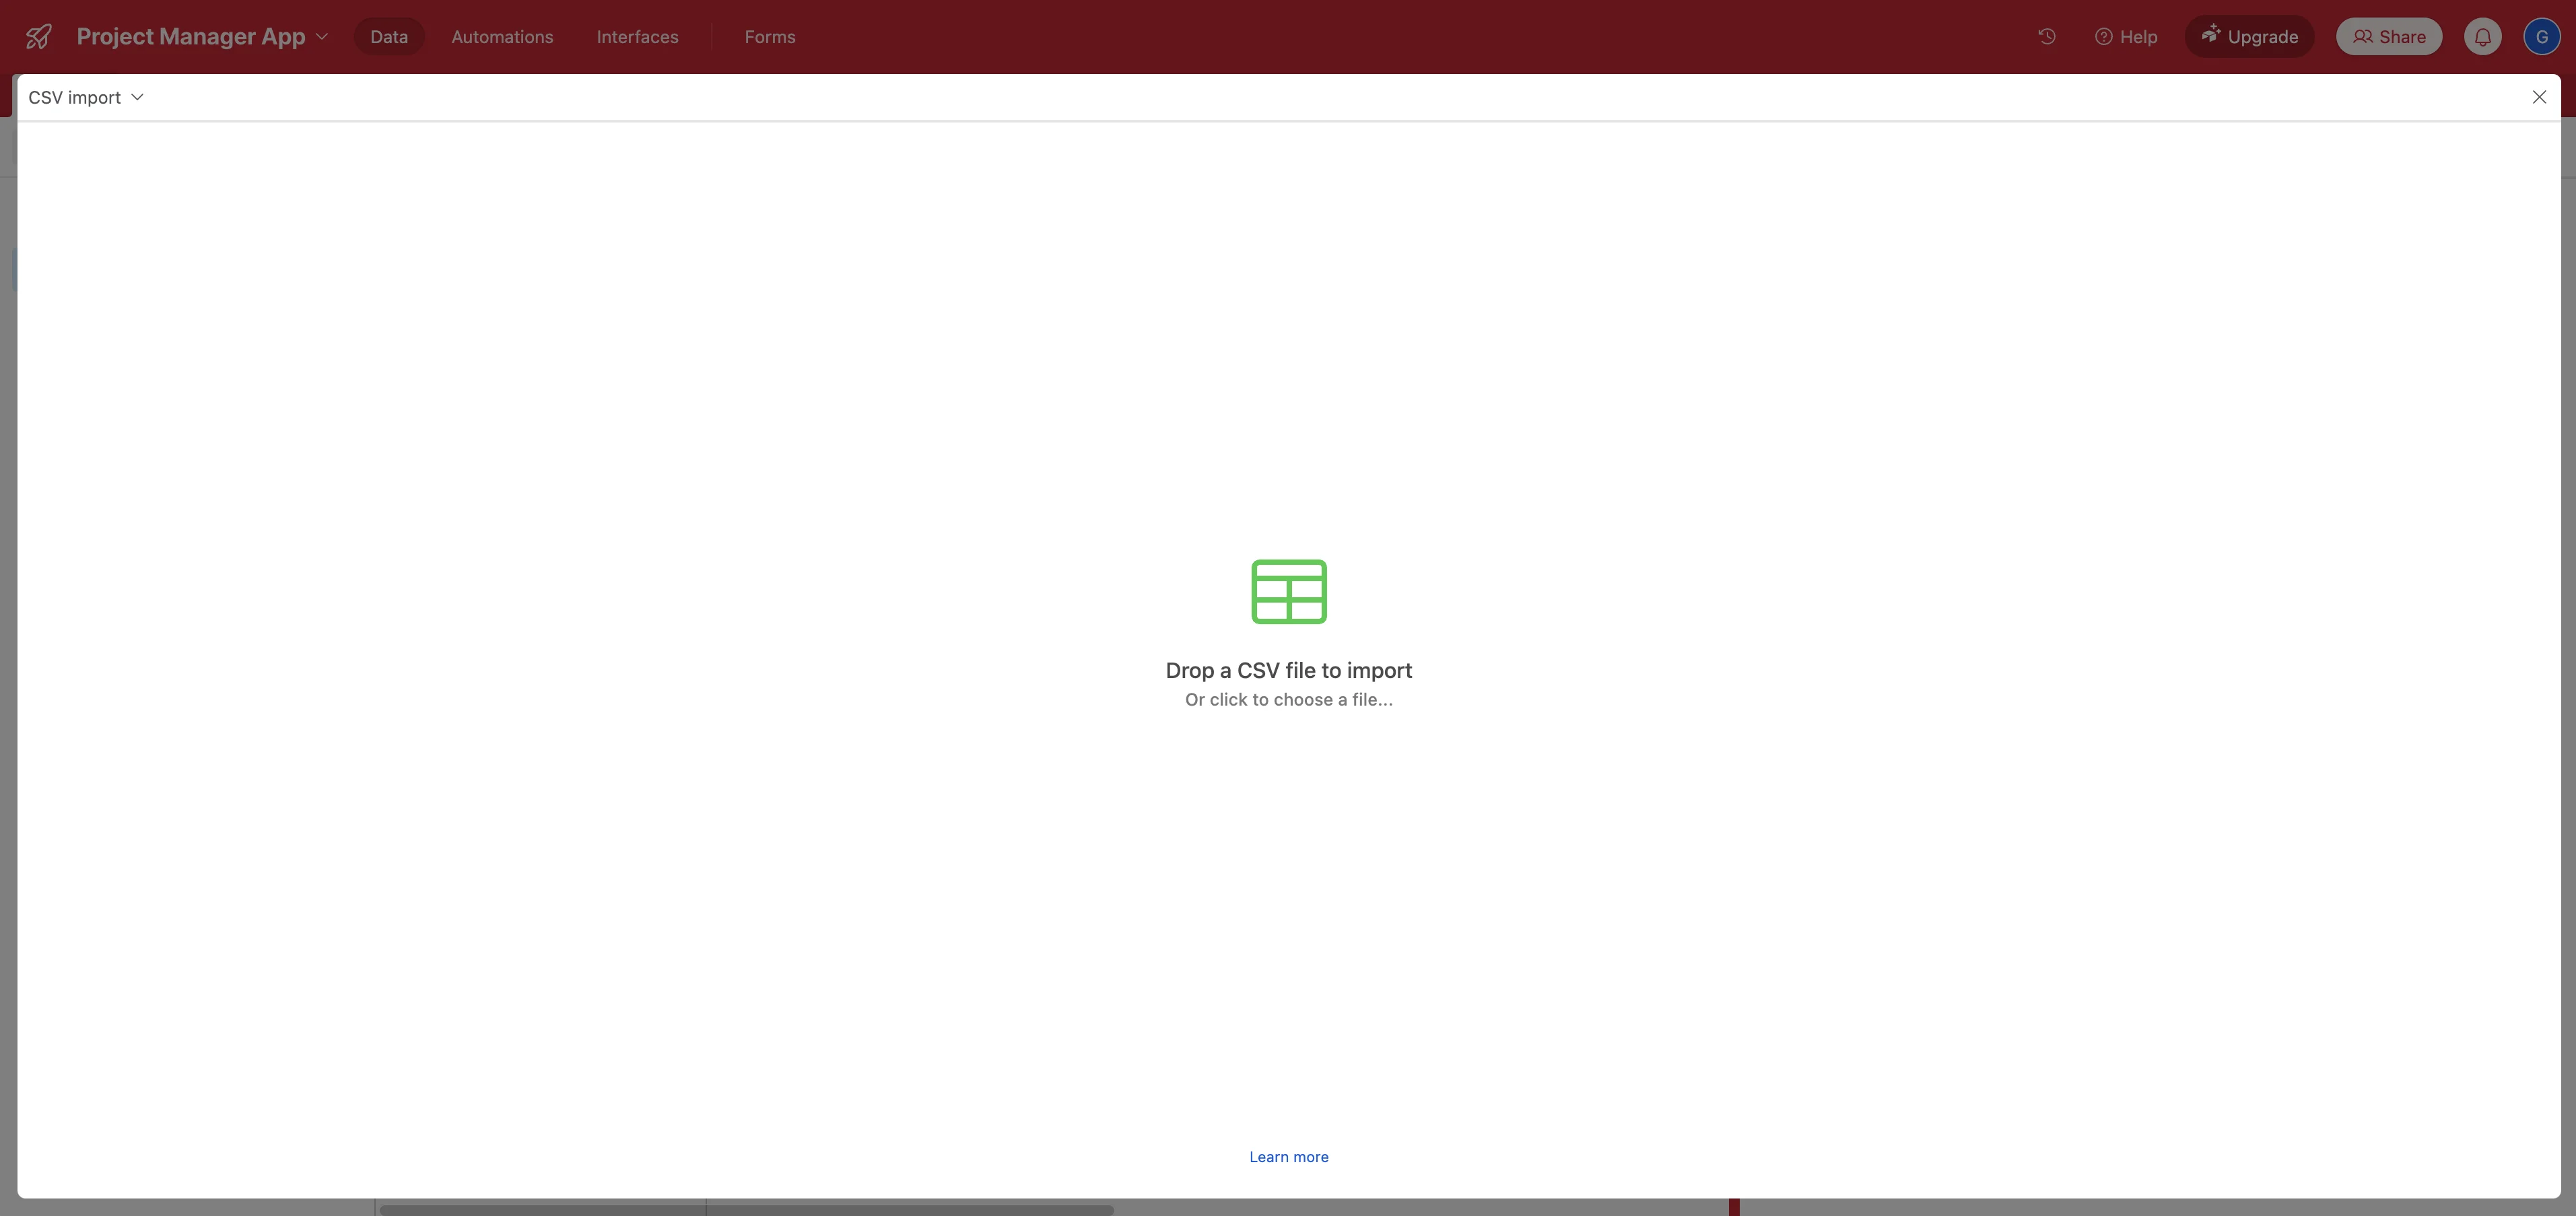
Now we can upload our project plan data via the ChatGPT-generated CSV file from the previous lesson. To do this, click the “Extensions” tab on the right side of the page.
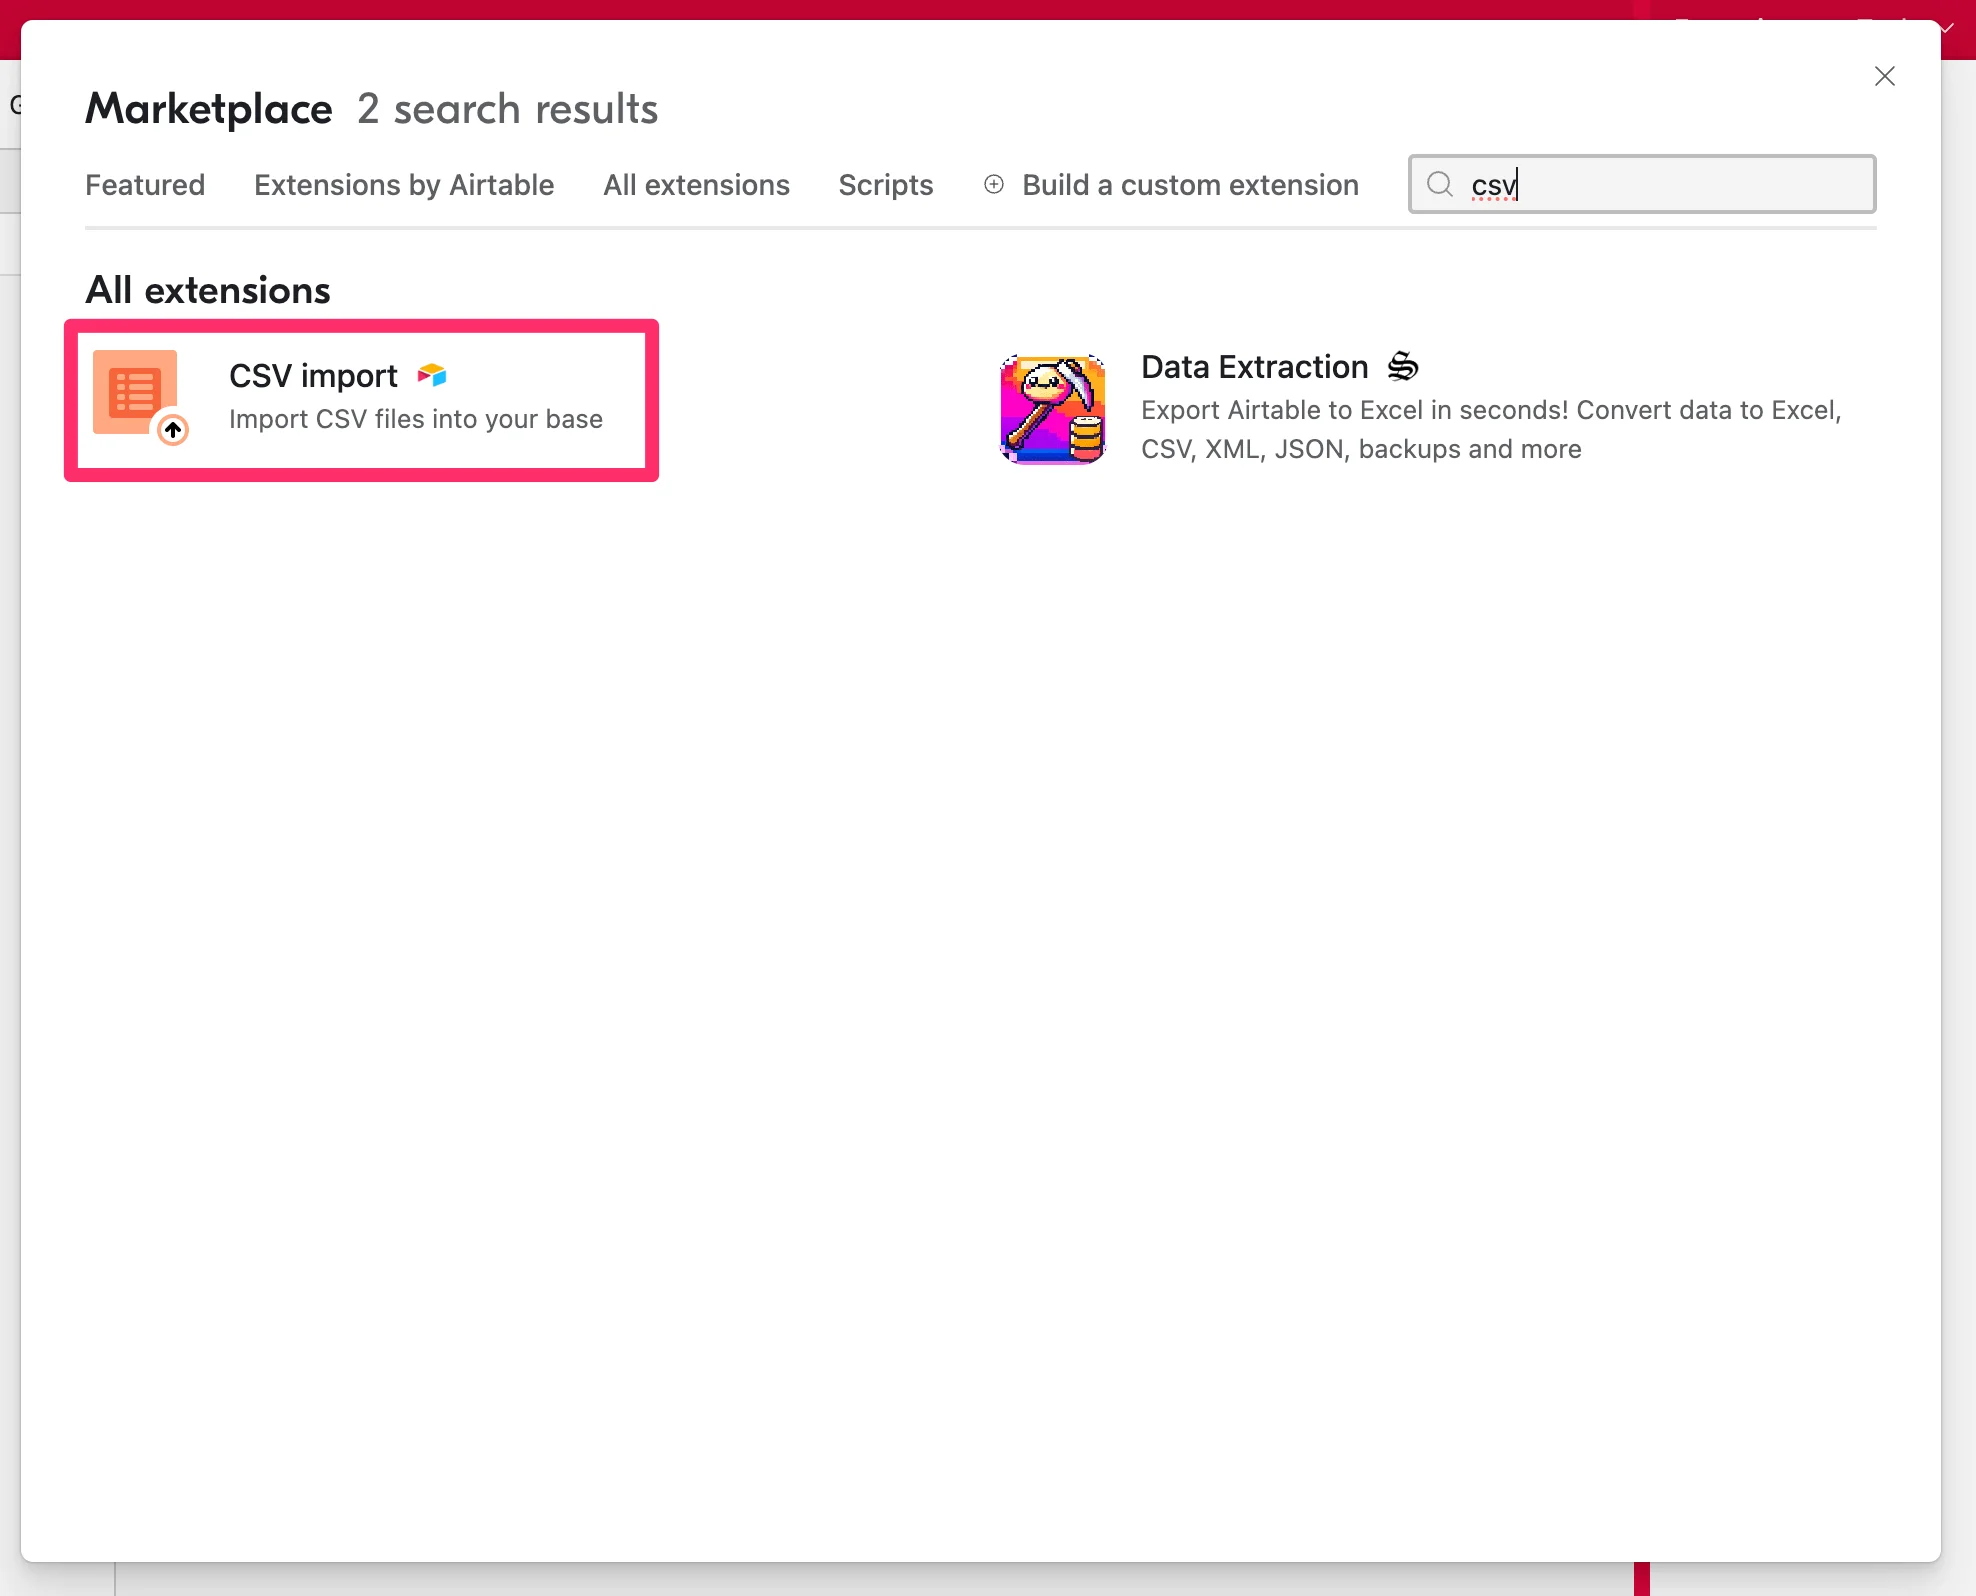
Search for “CSV” in the resulting pop-up and select the “CSV import” extension.
Click and upload your CSV of task data for the project.
In the resulting window, we’ll map our CSV file fields to the column headers of our Airtable table. Most of these should auto-map since they are the same names, but for those that don’t, enable the Table field and map it to the corresponding CSV column. Click “Save records” when you’re done with this step.
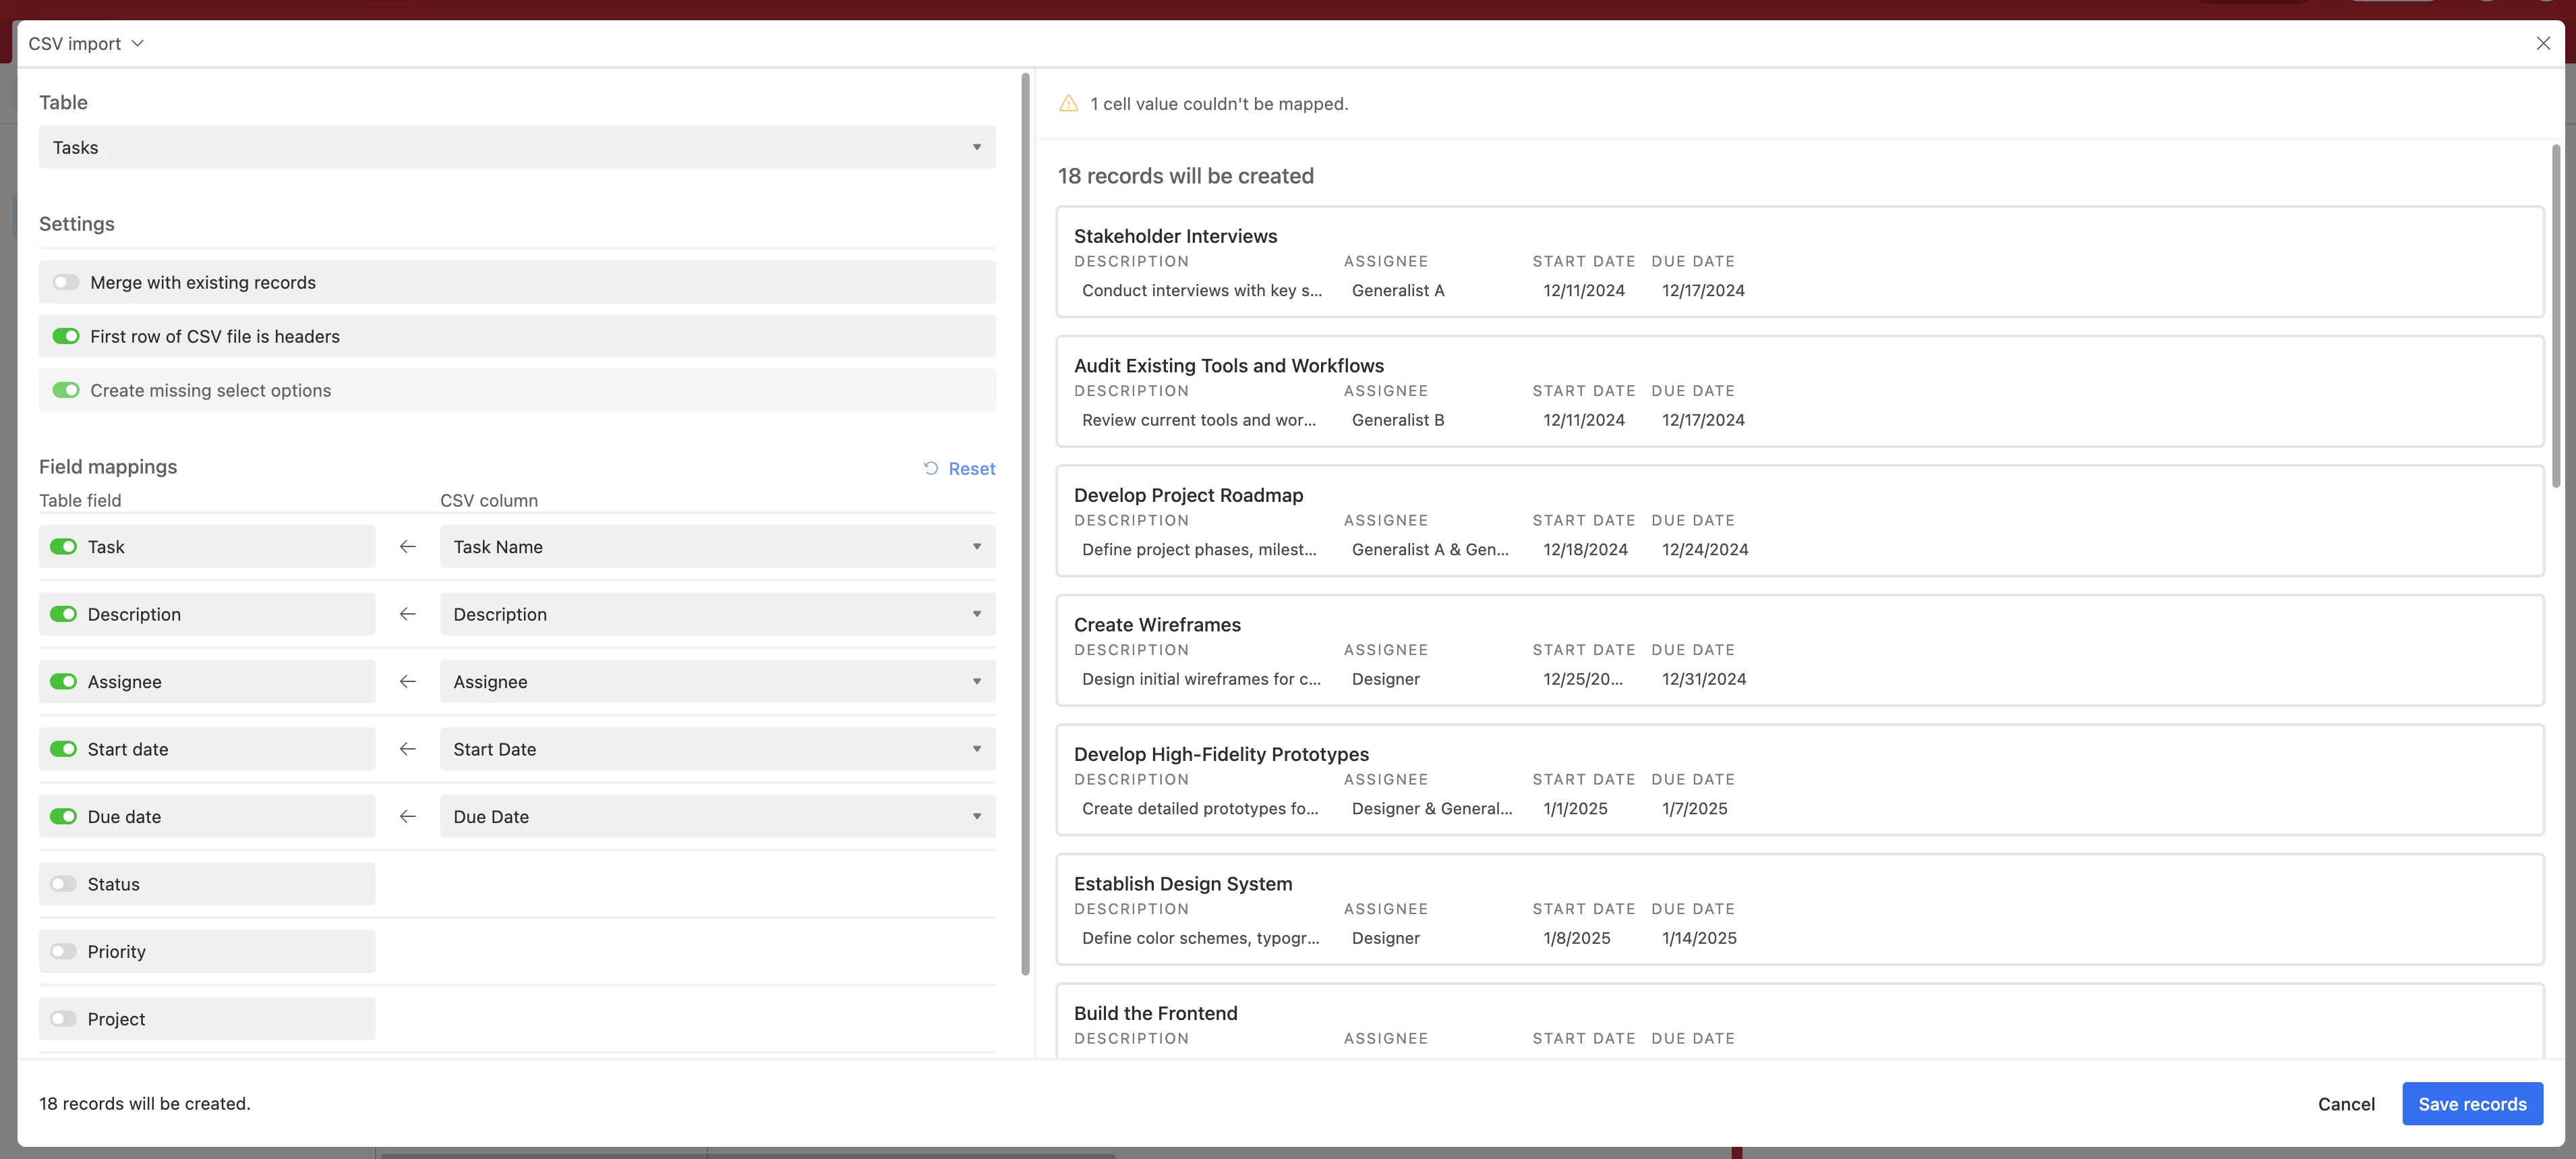
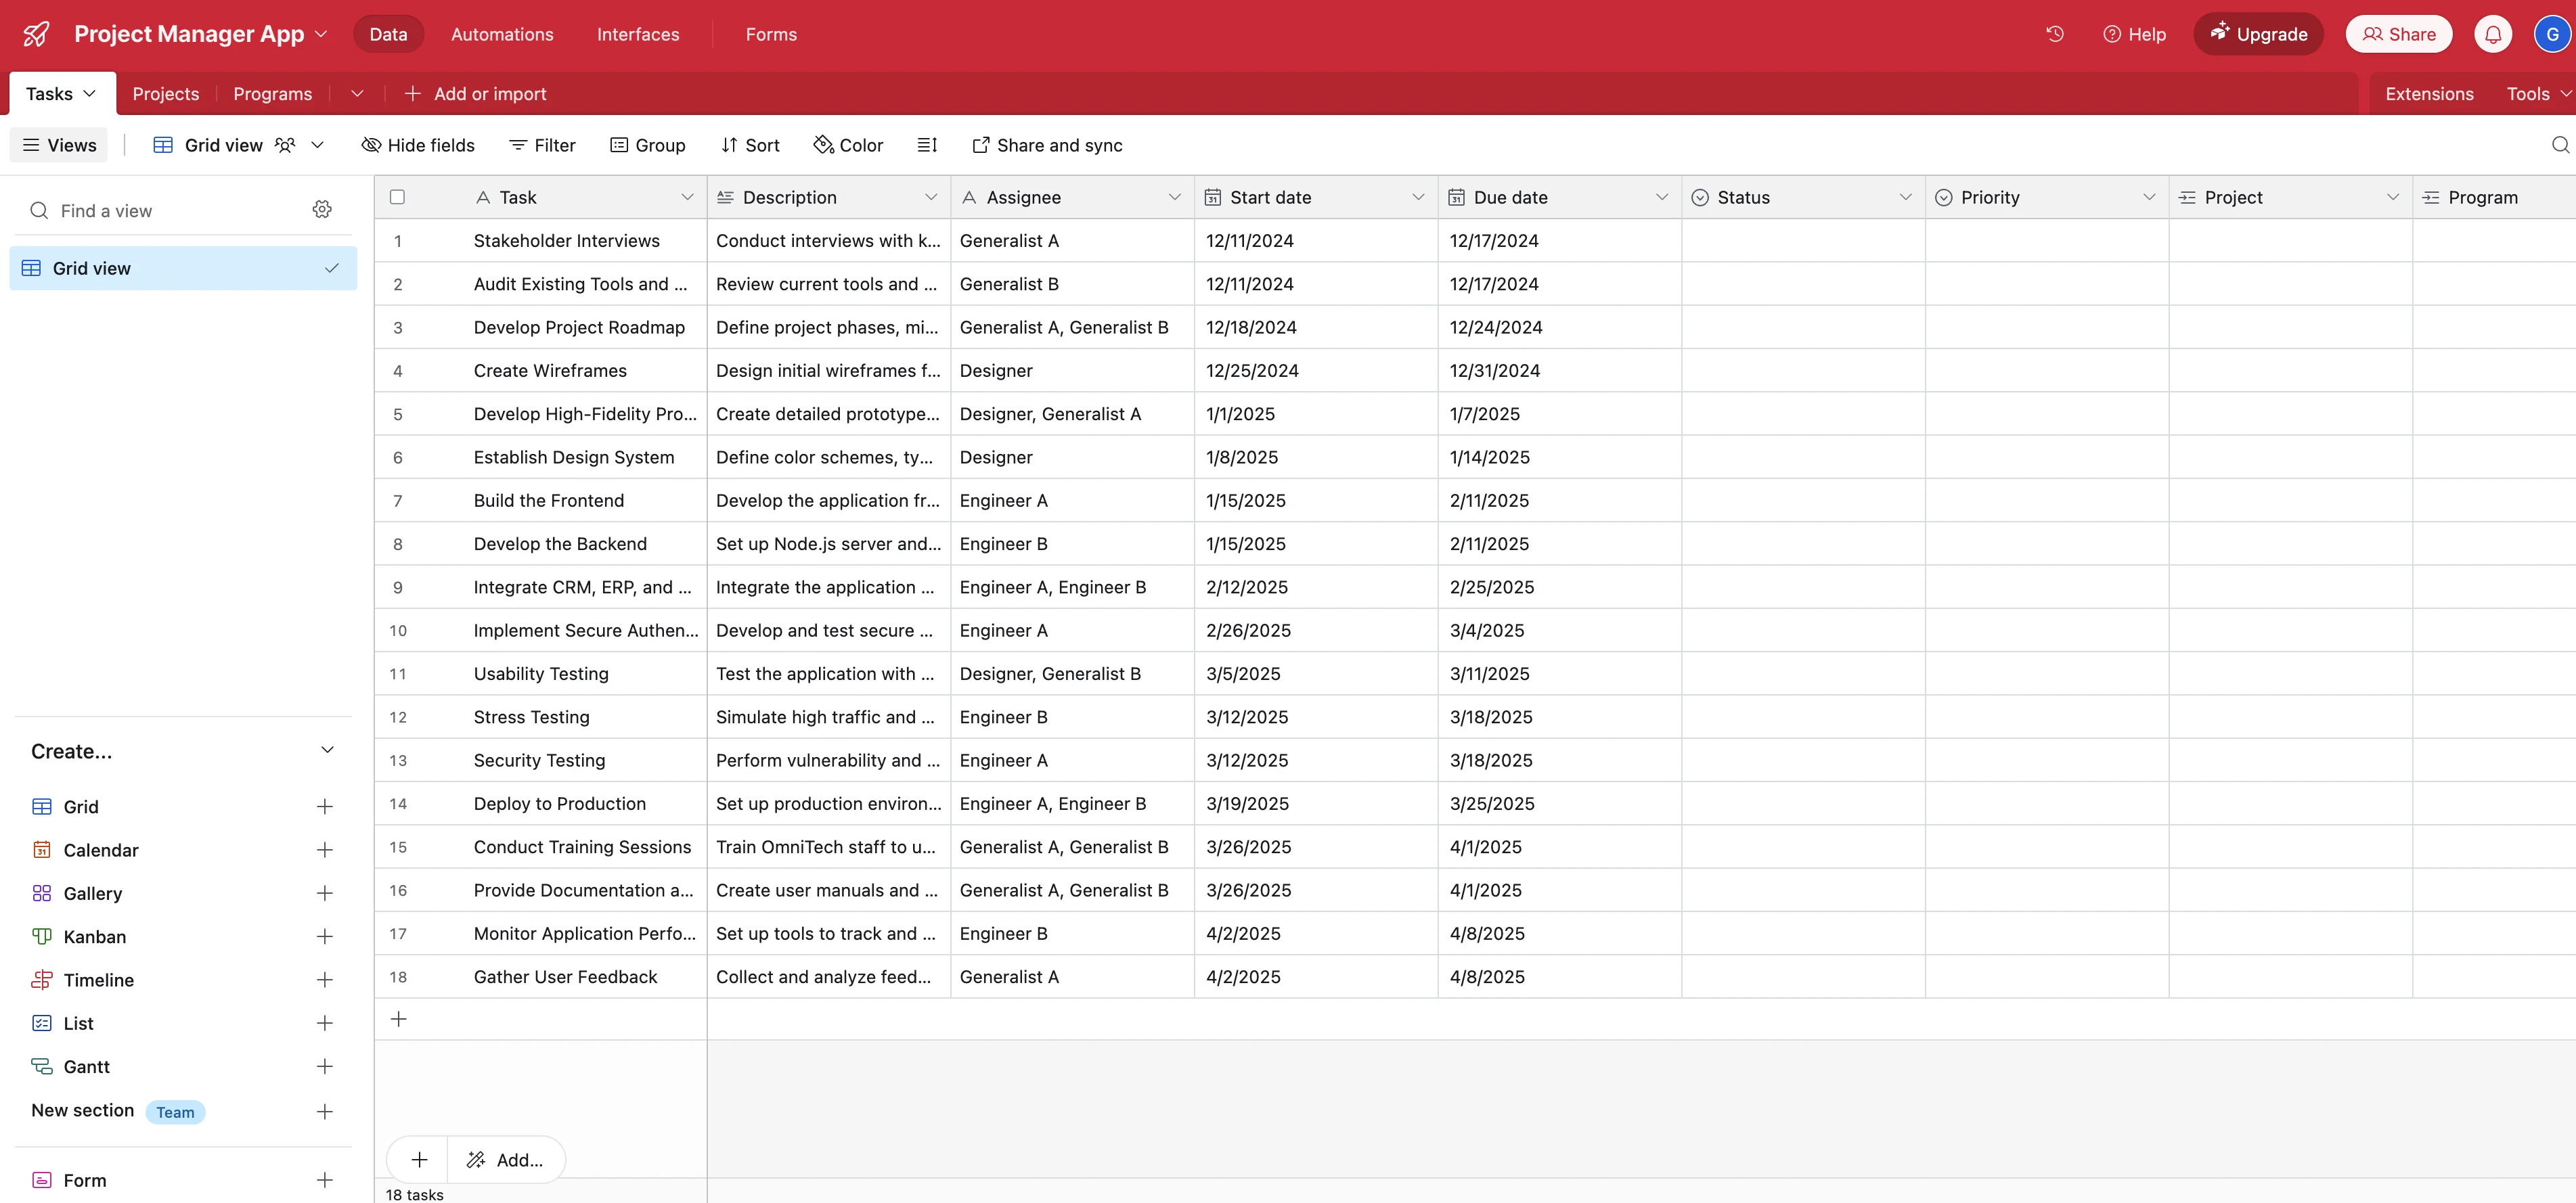
And just like that, you should have a populated Tasks table with the project plan tasks.
Add reporting and specialized interfaces
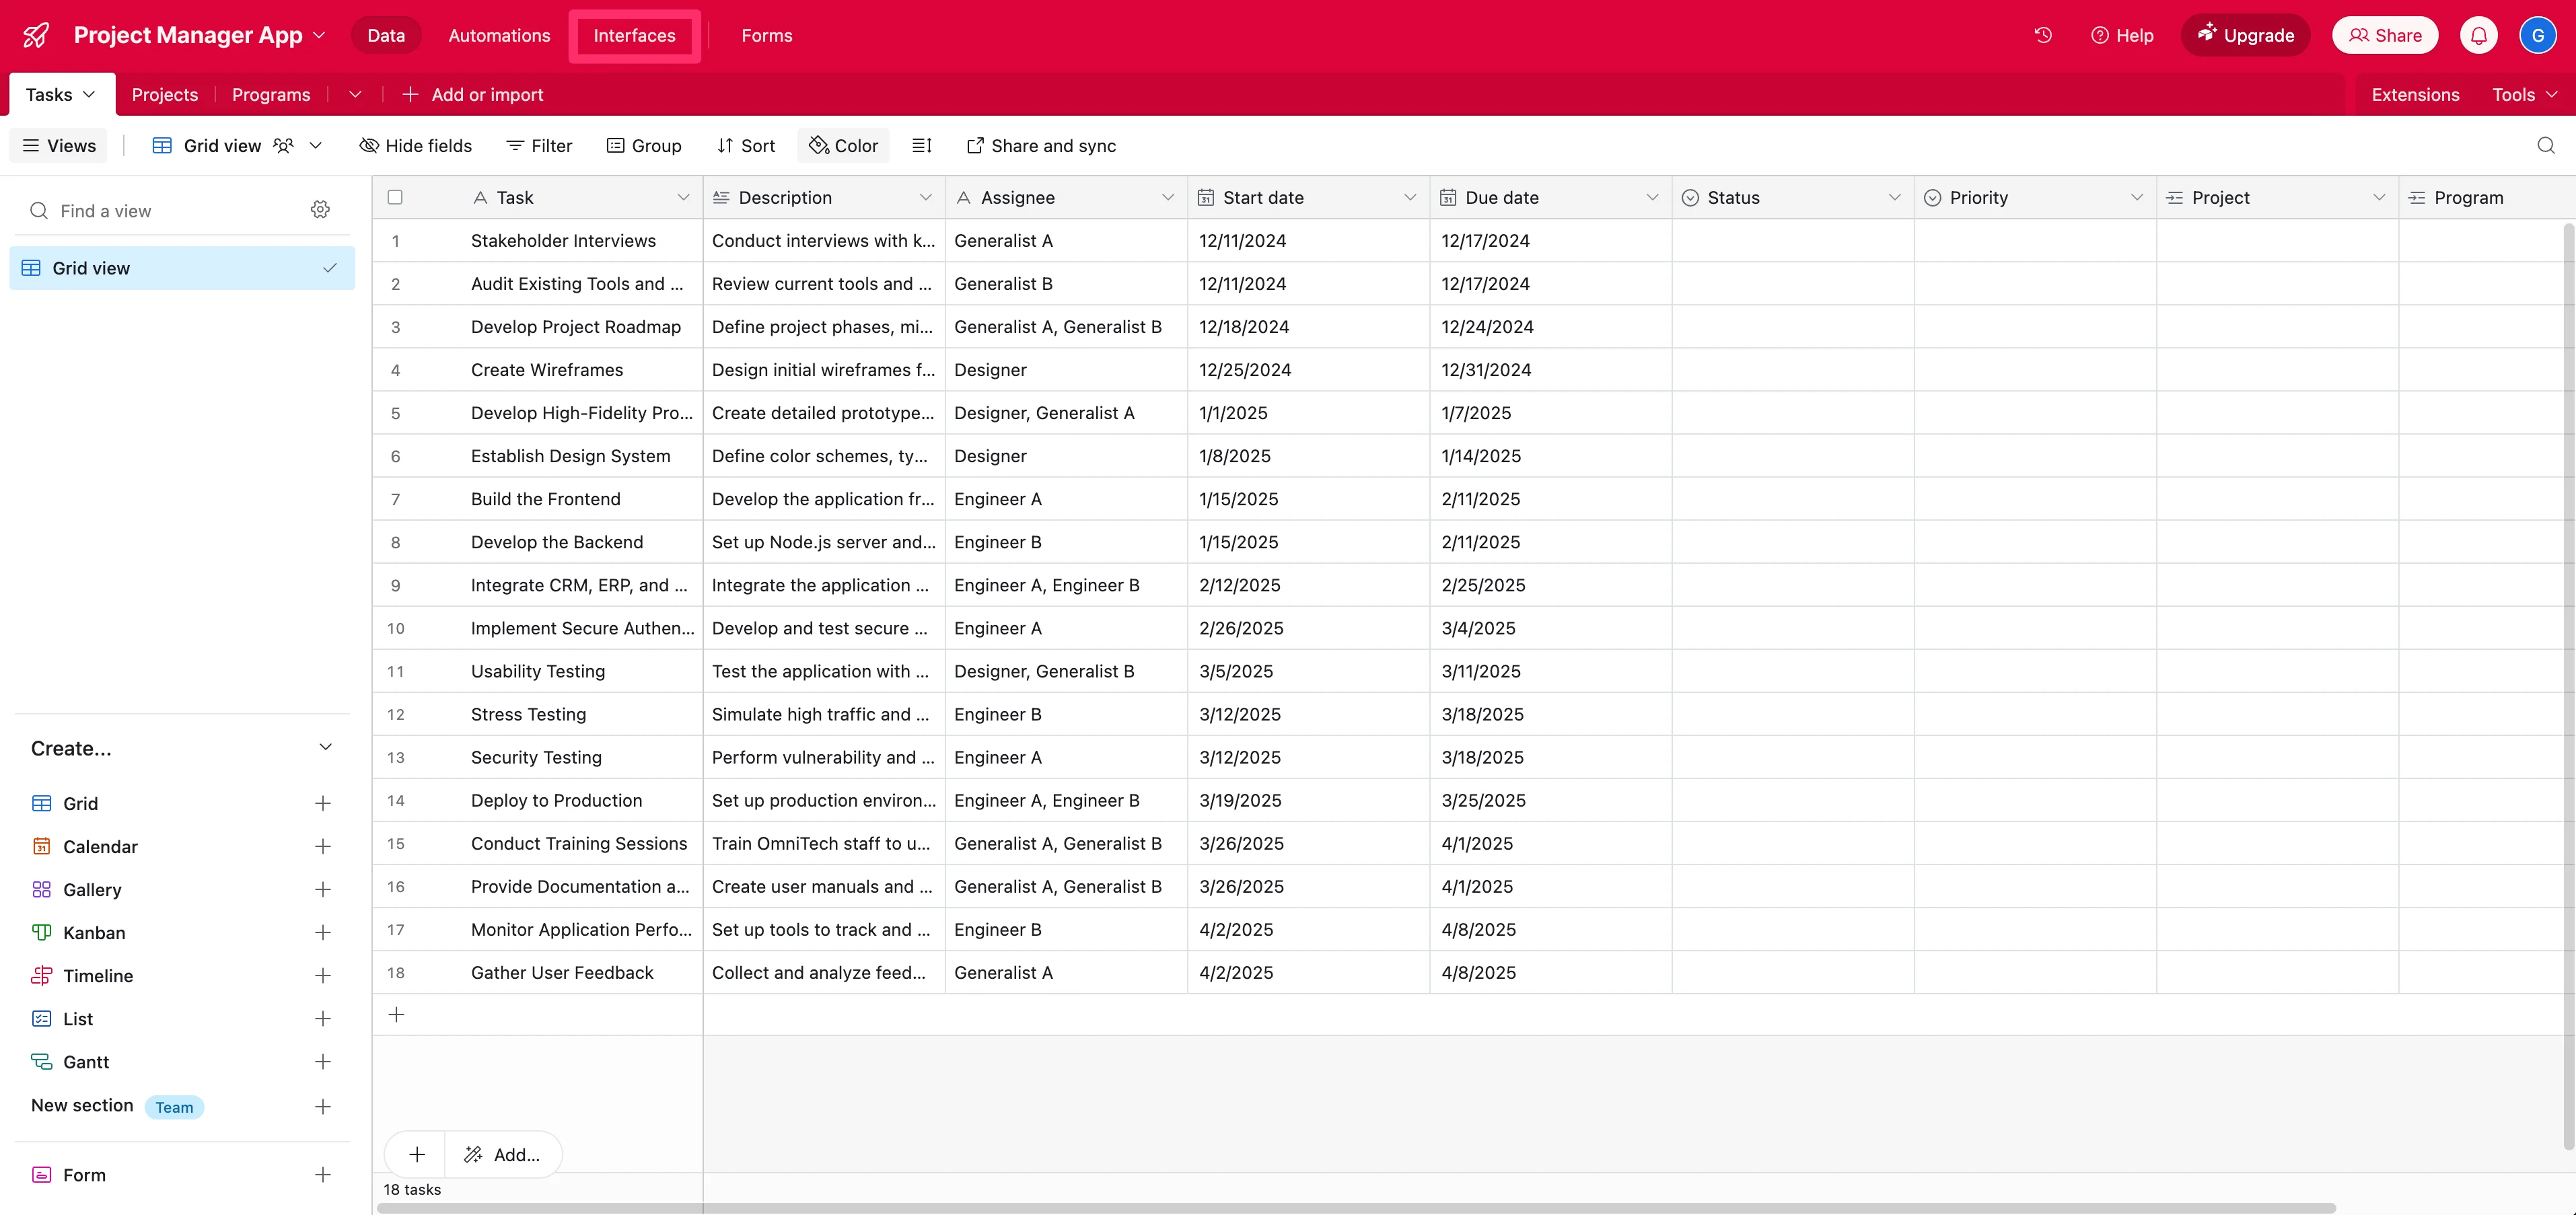
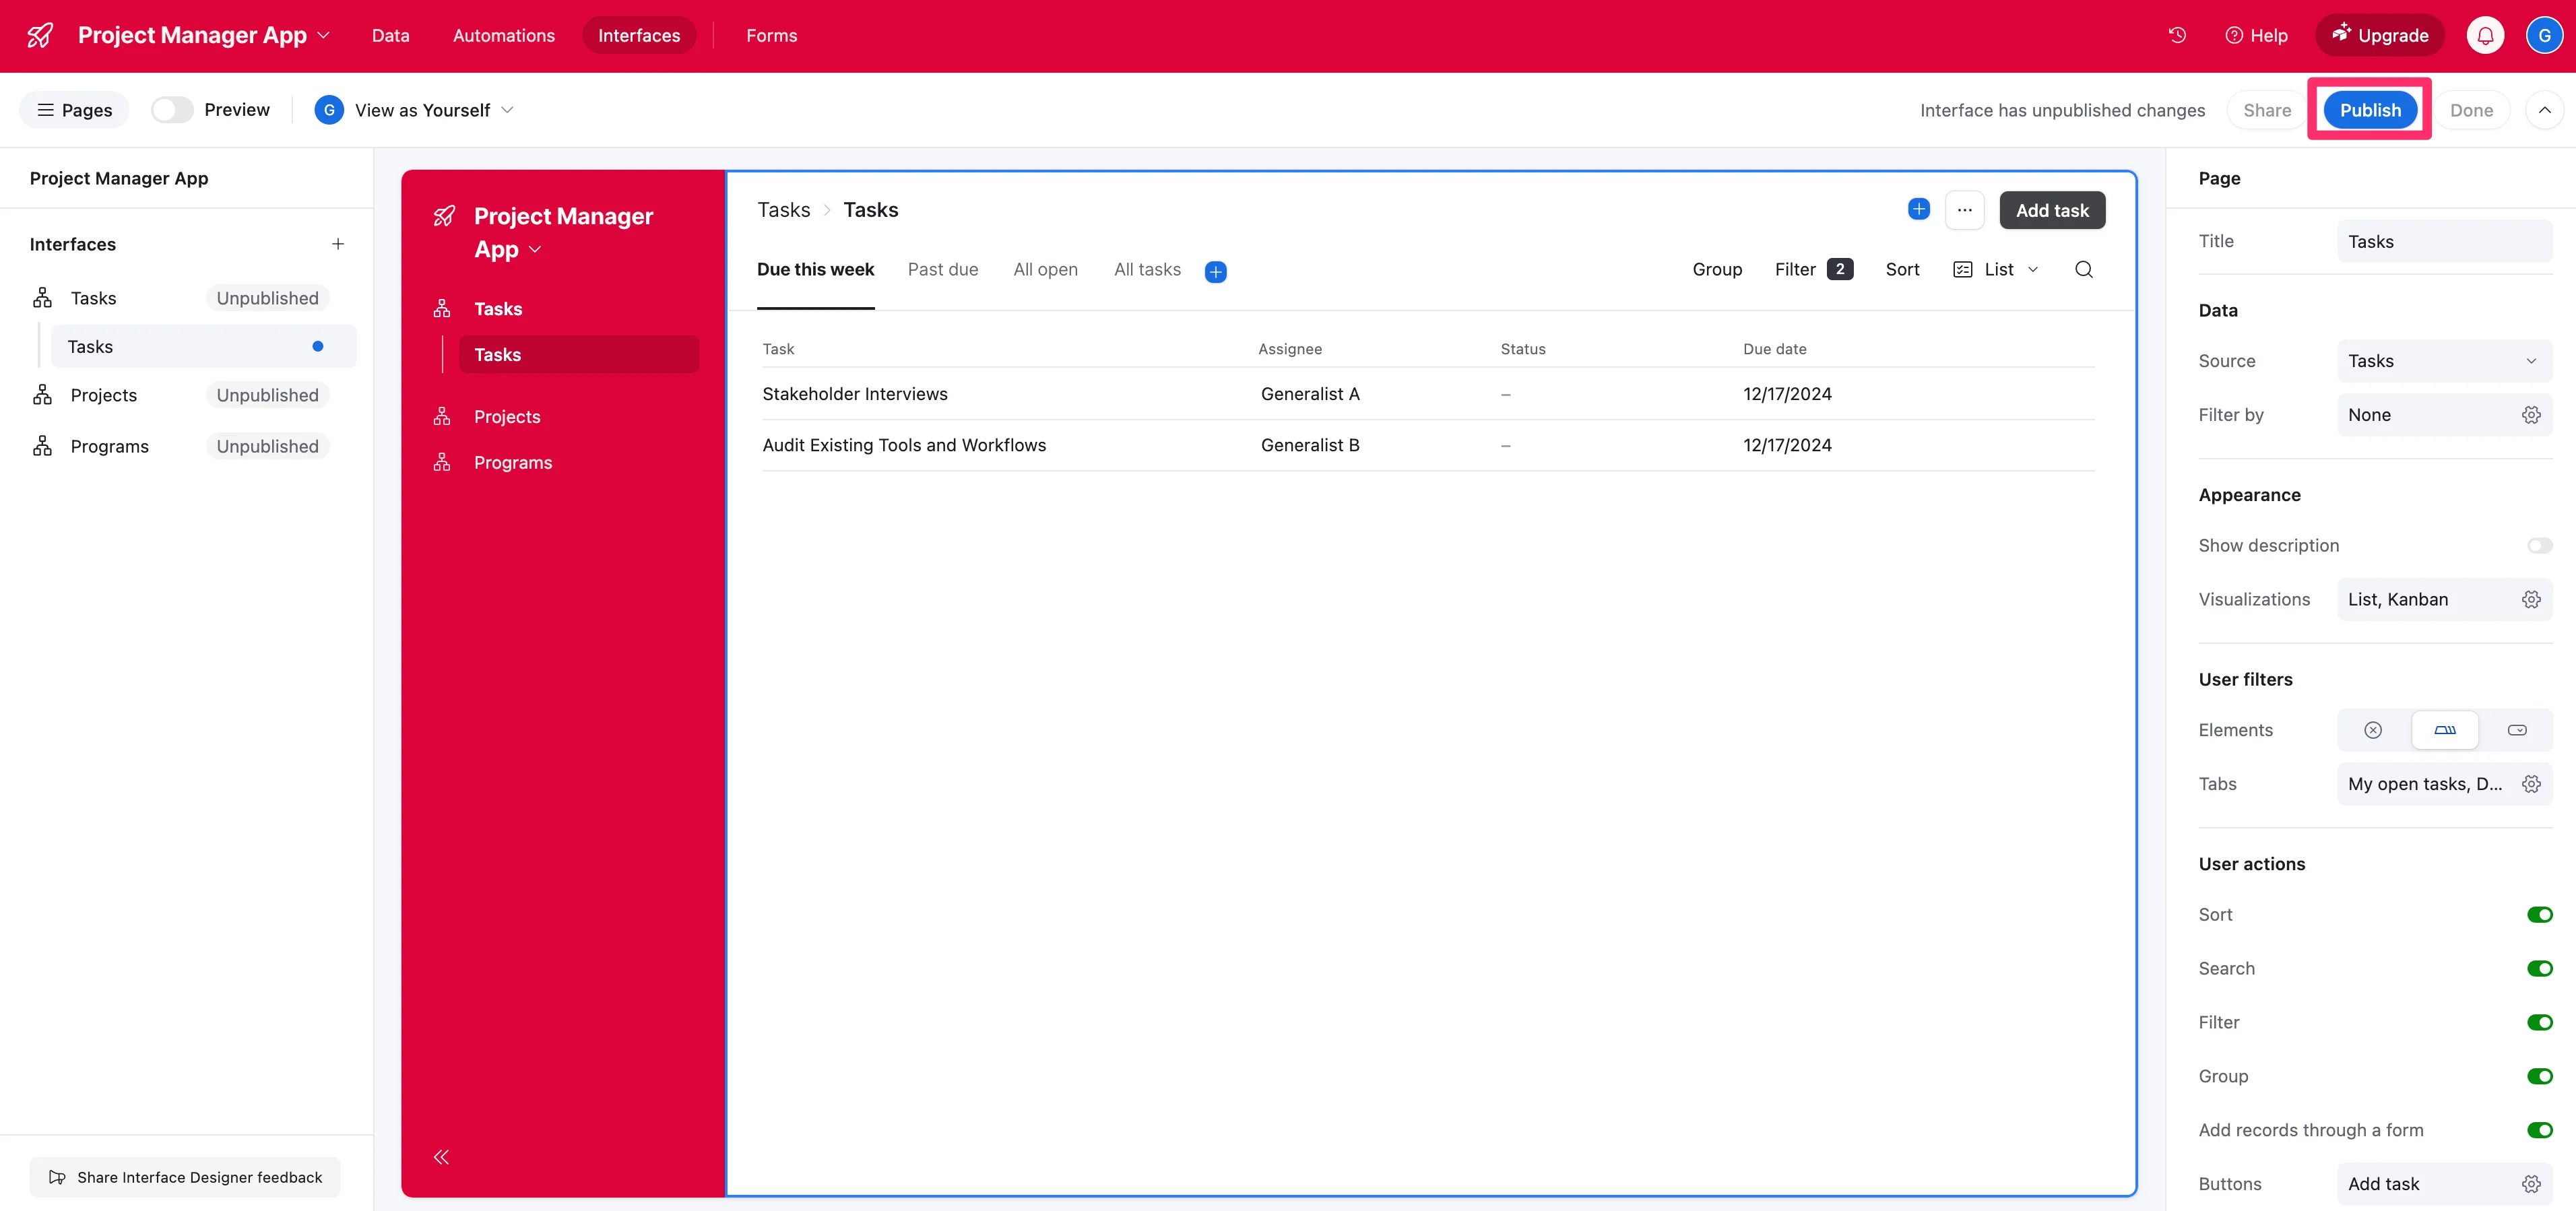
Now that our project plan data is in Airtable, we can tailor our app interfaces for other end users and create reporting dashboards as well. To do this, click the “Interface” tab at the top of the page.
You can make any tweaks to the Tasks interface page here using the right-side page editor. When you’re happy with the page, click the “Publish” button.
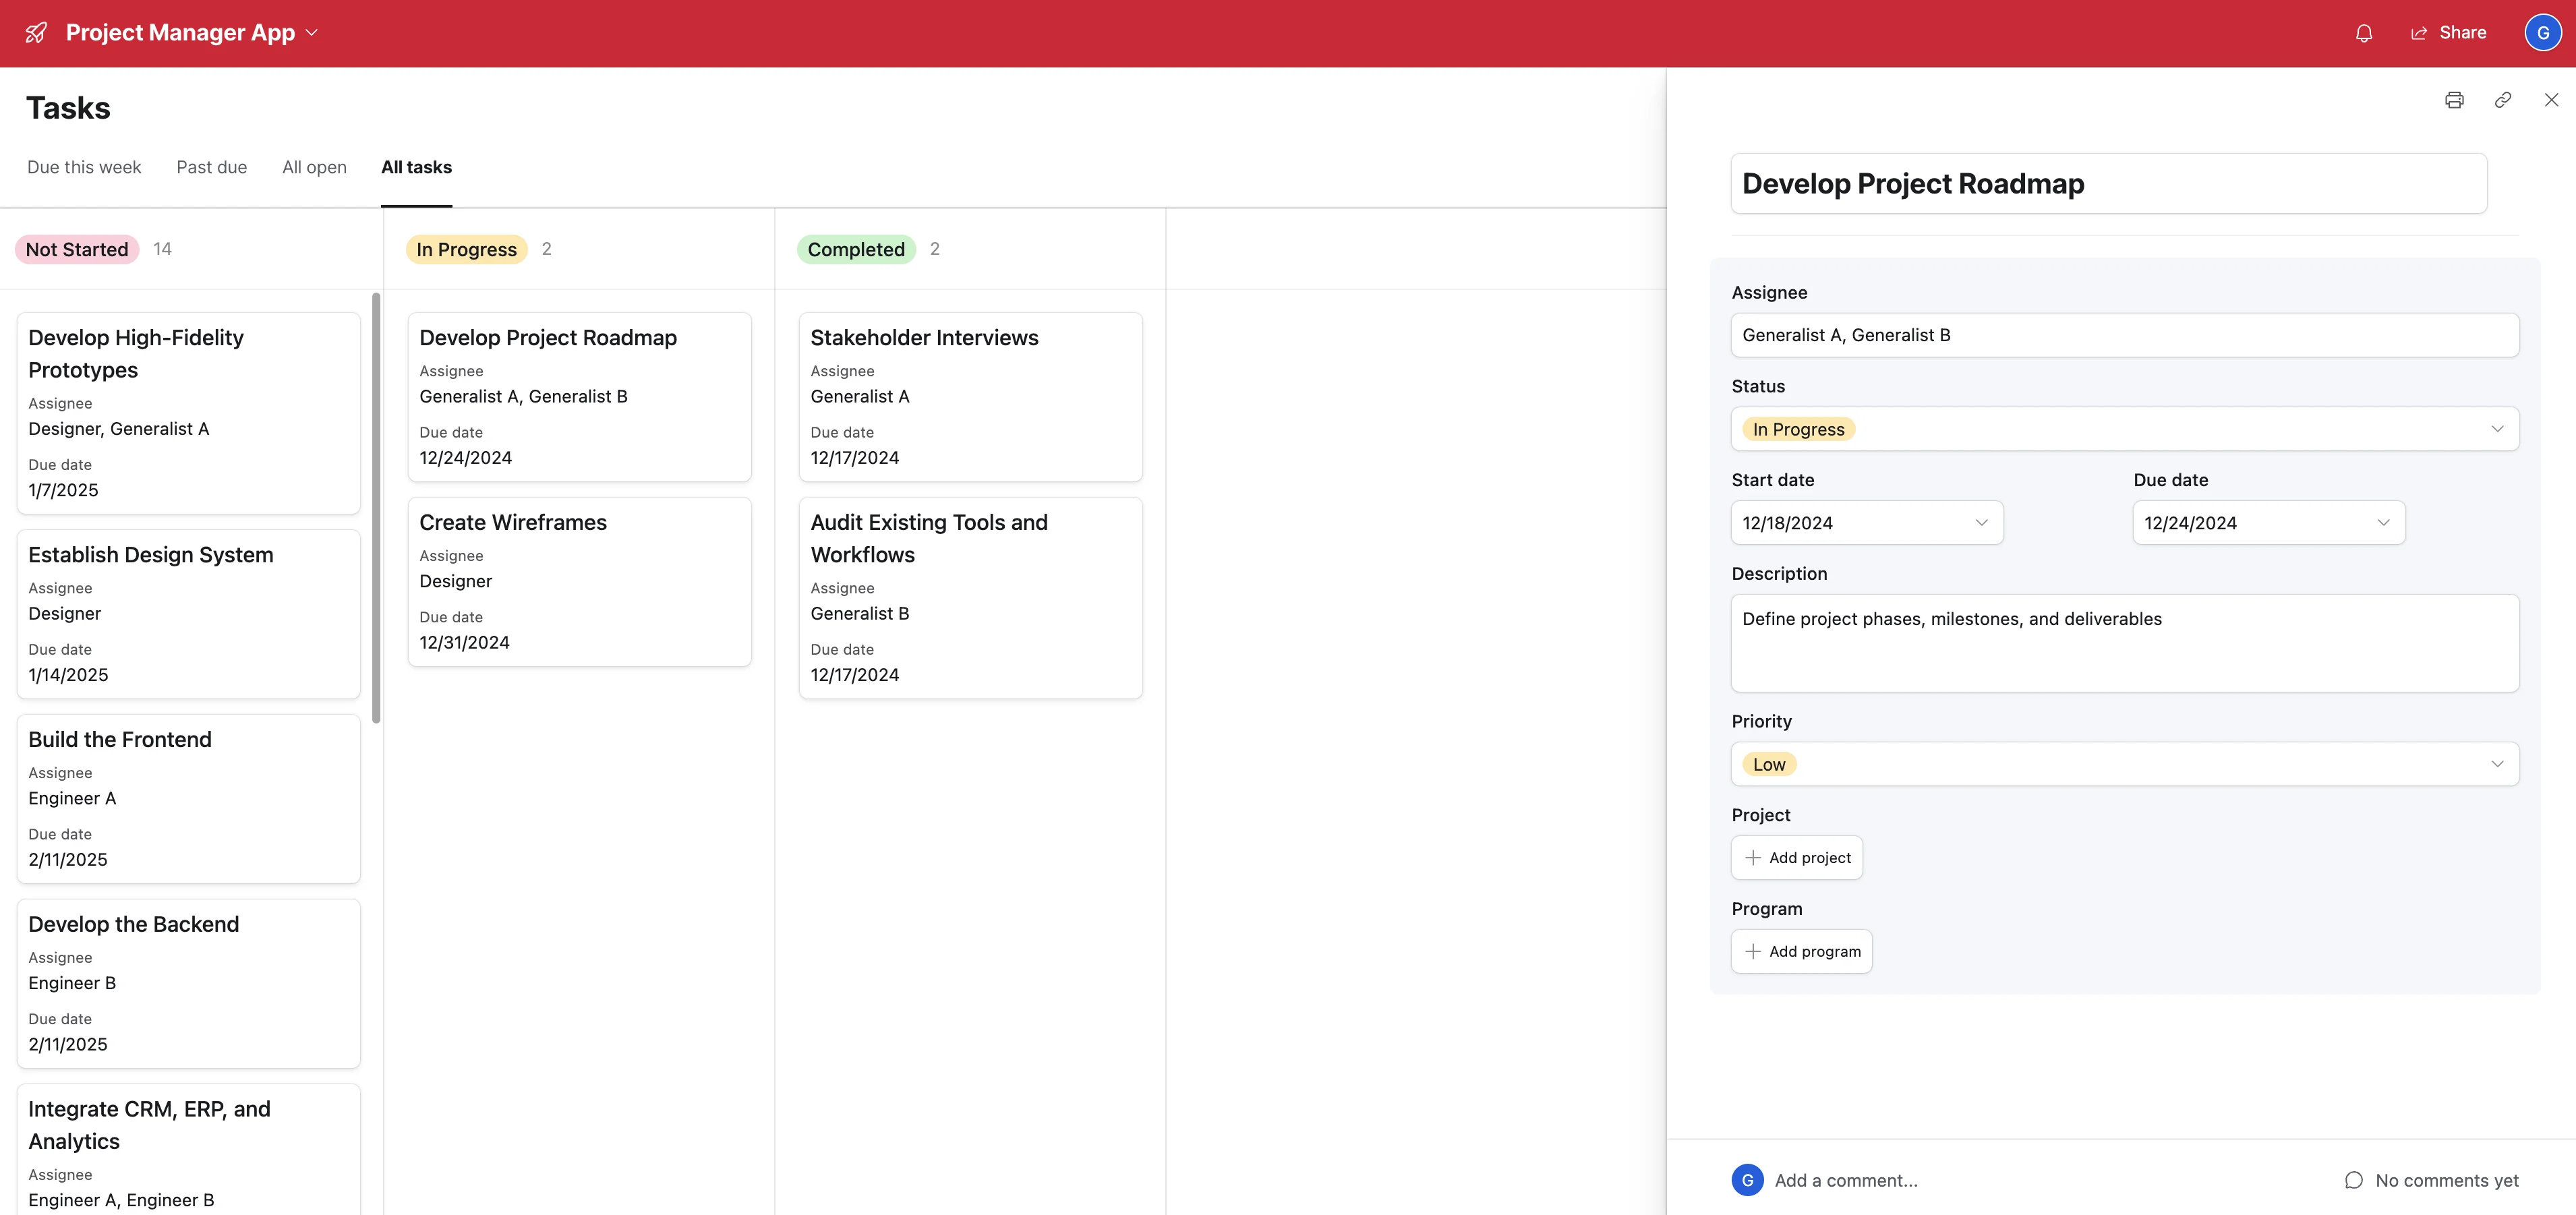
Navigate to the “All tasks” tab. You should have a full Kanban experience with a details sidebar for your tasks. You can add other visualizations and share these views with your team.
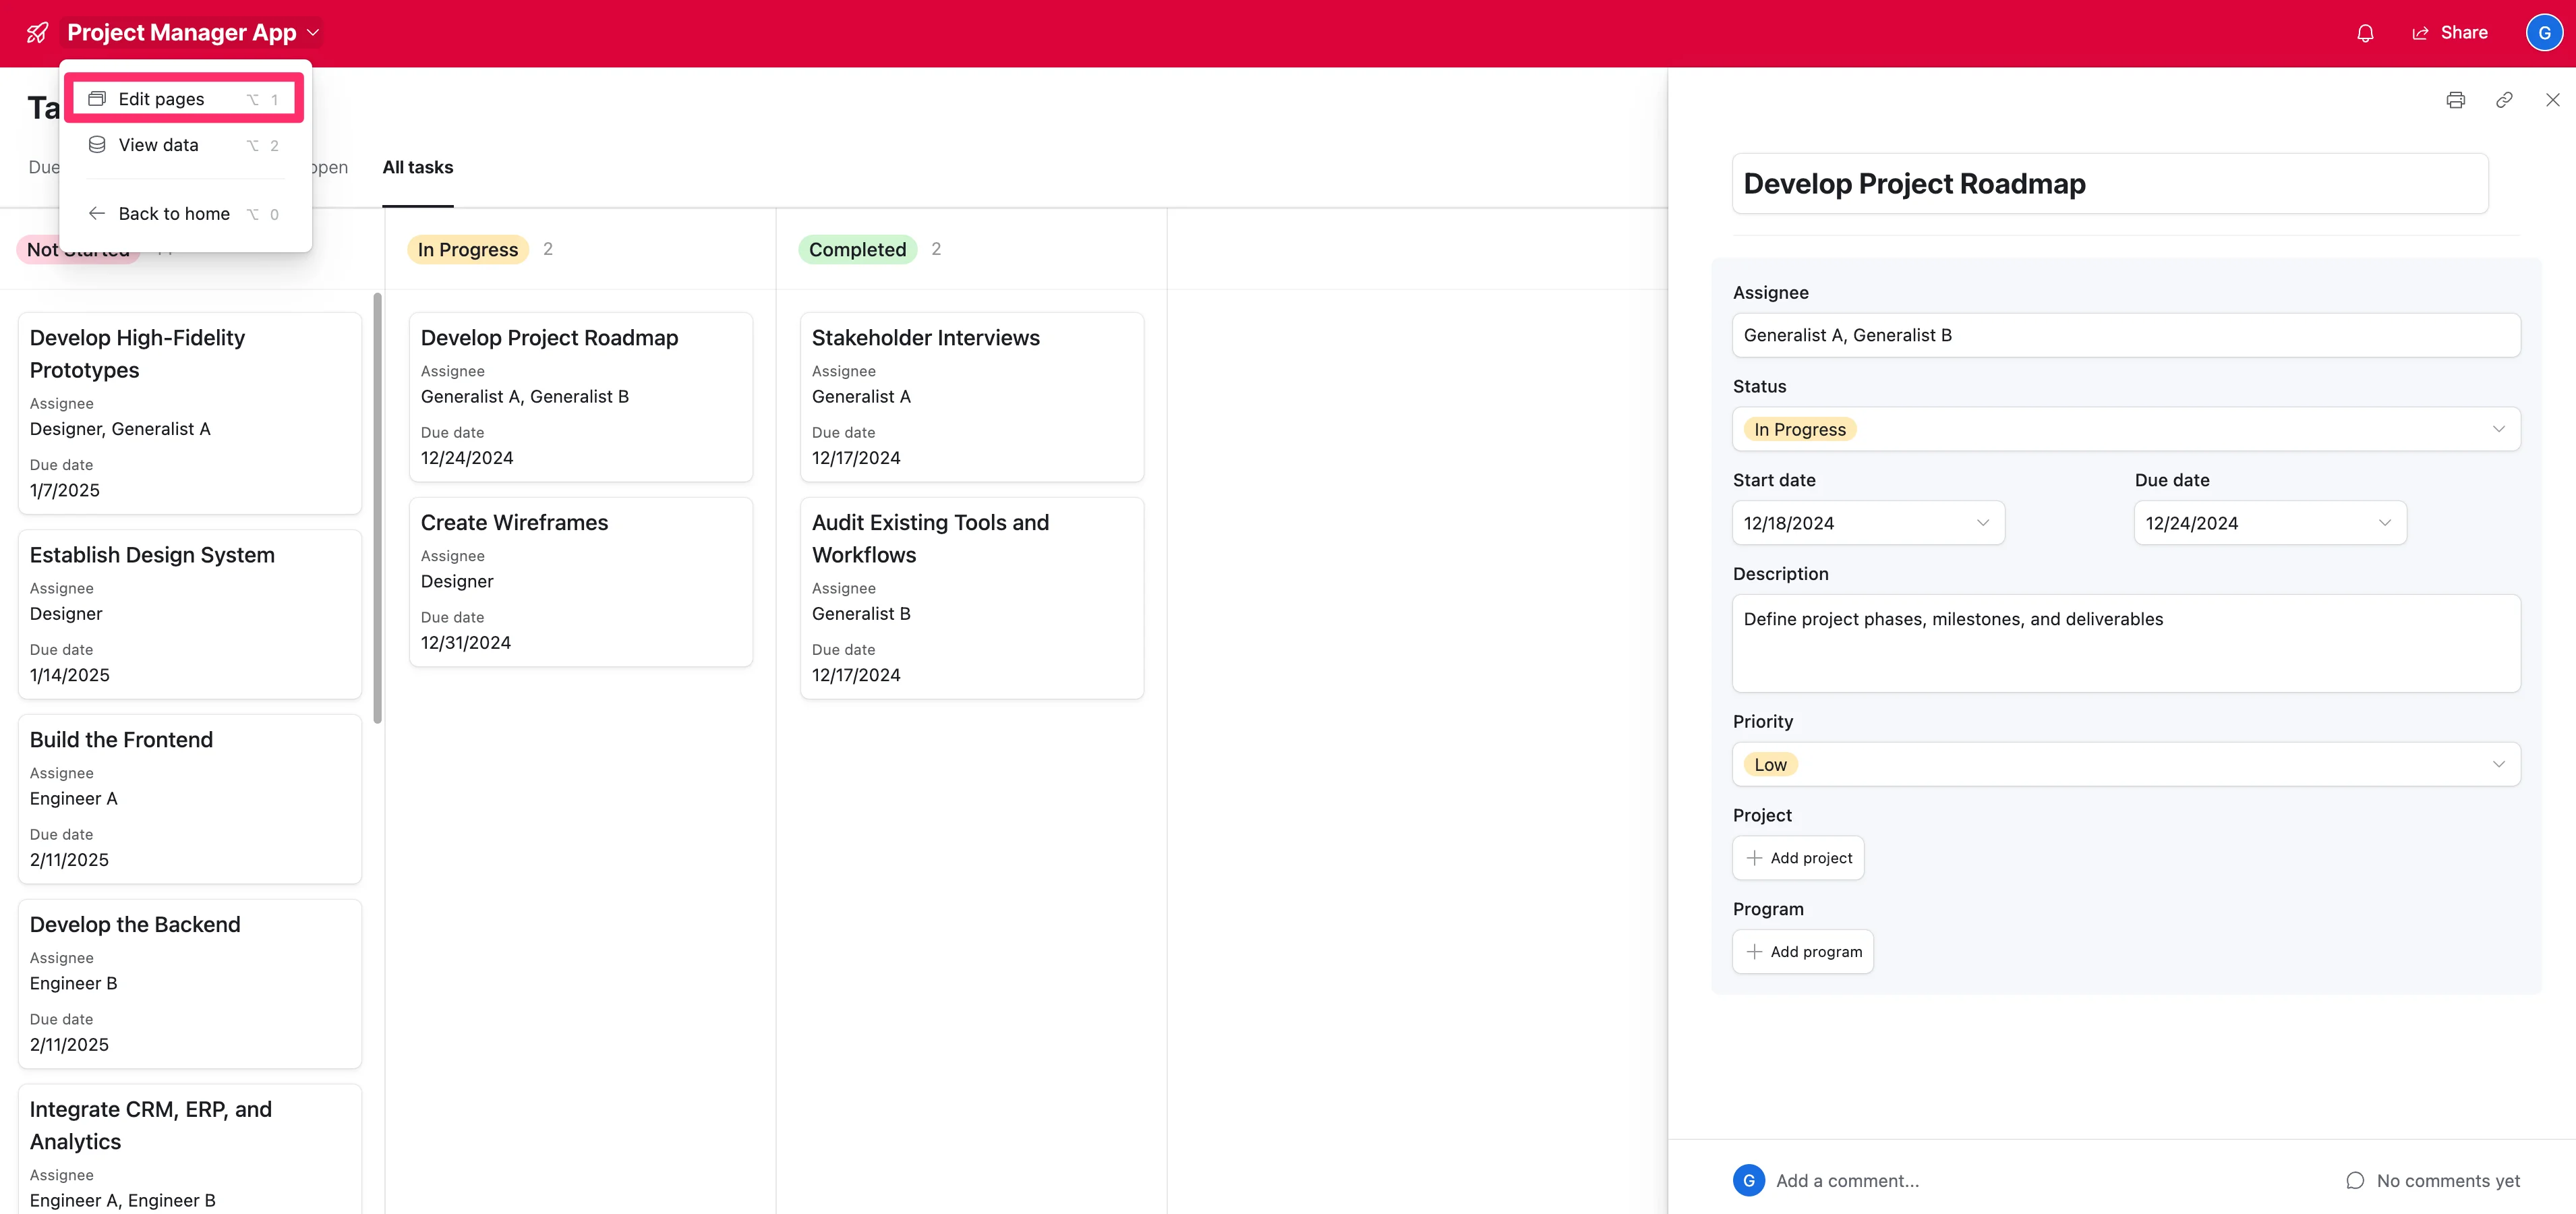
Now, let’s create a reporting dashboard for our project. To do this, click the Base name in the top left corner and select the “Edit pages” option from the dropdown menu.
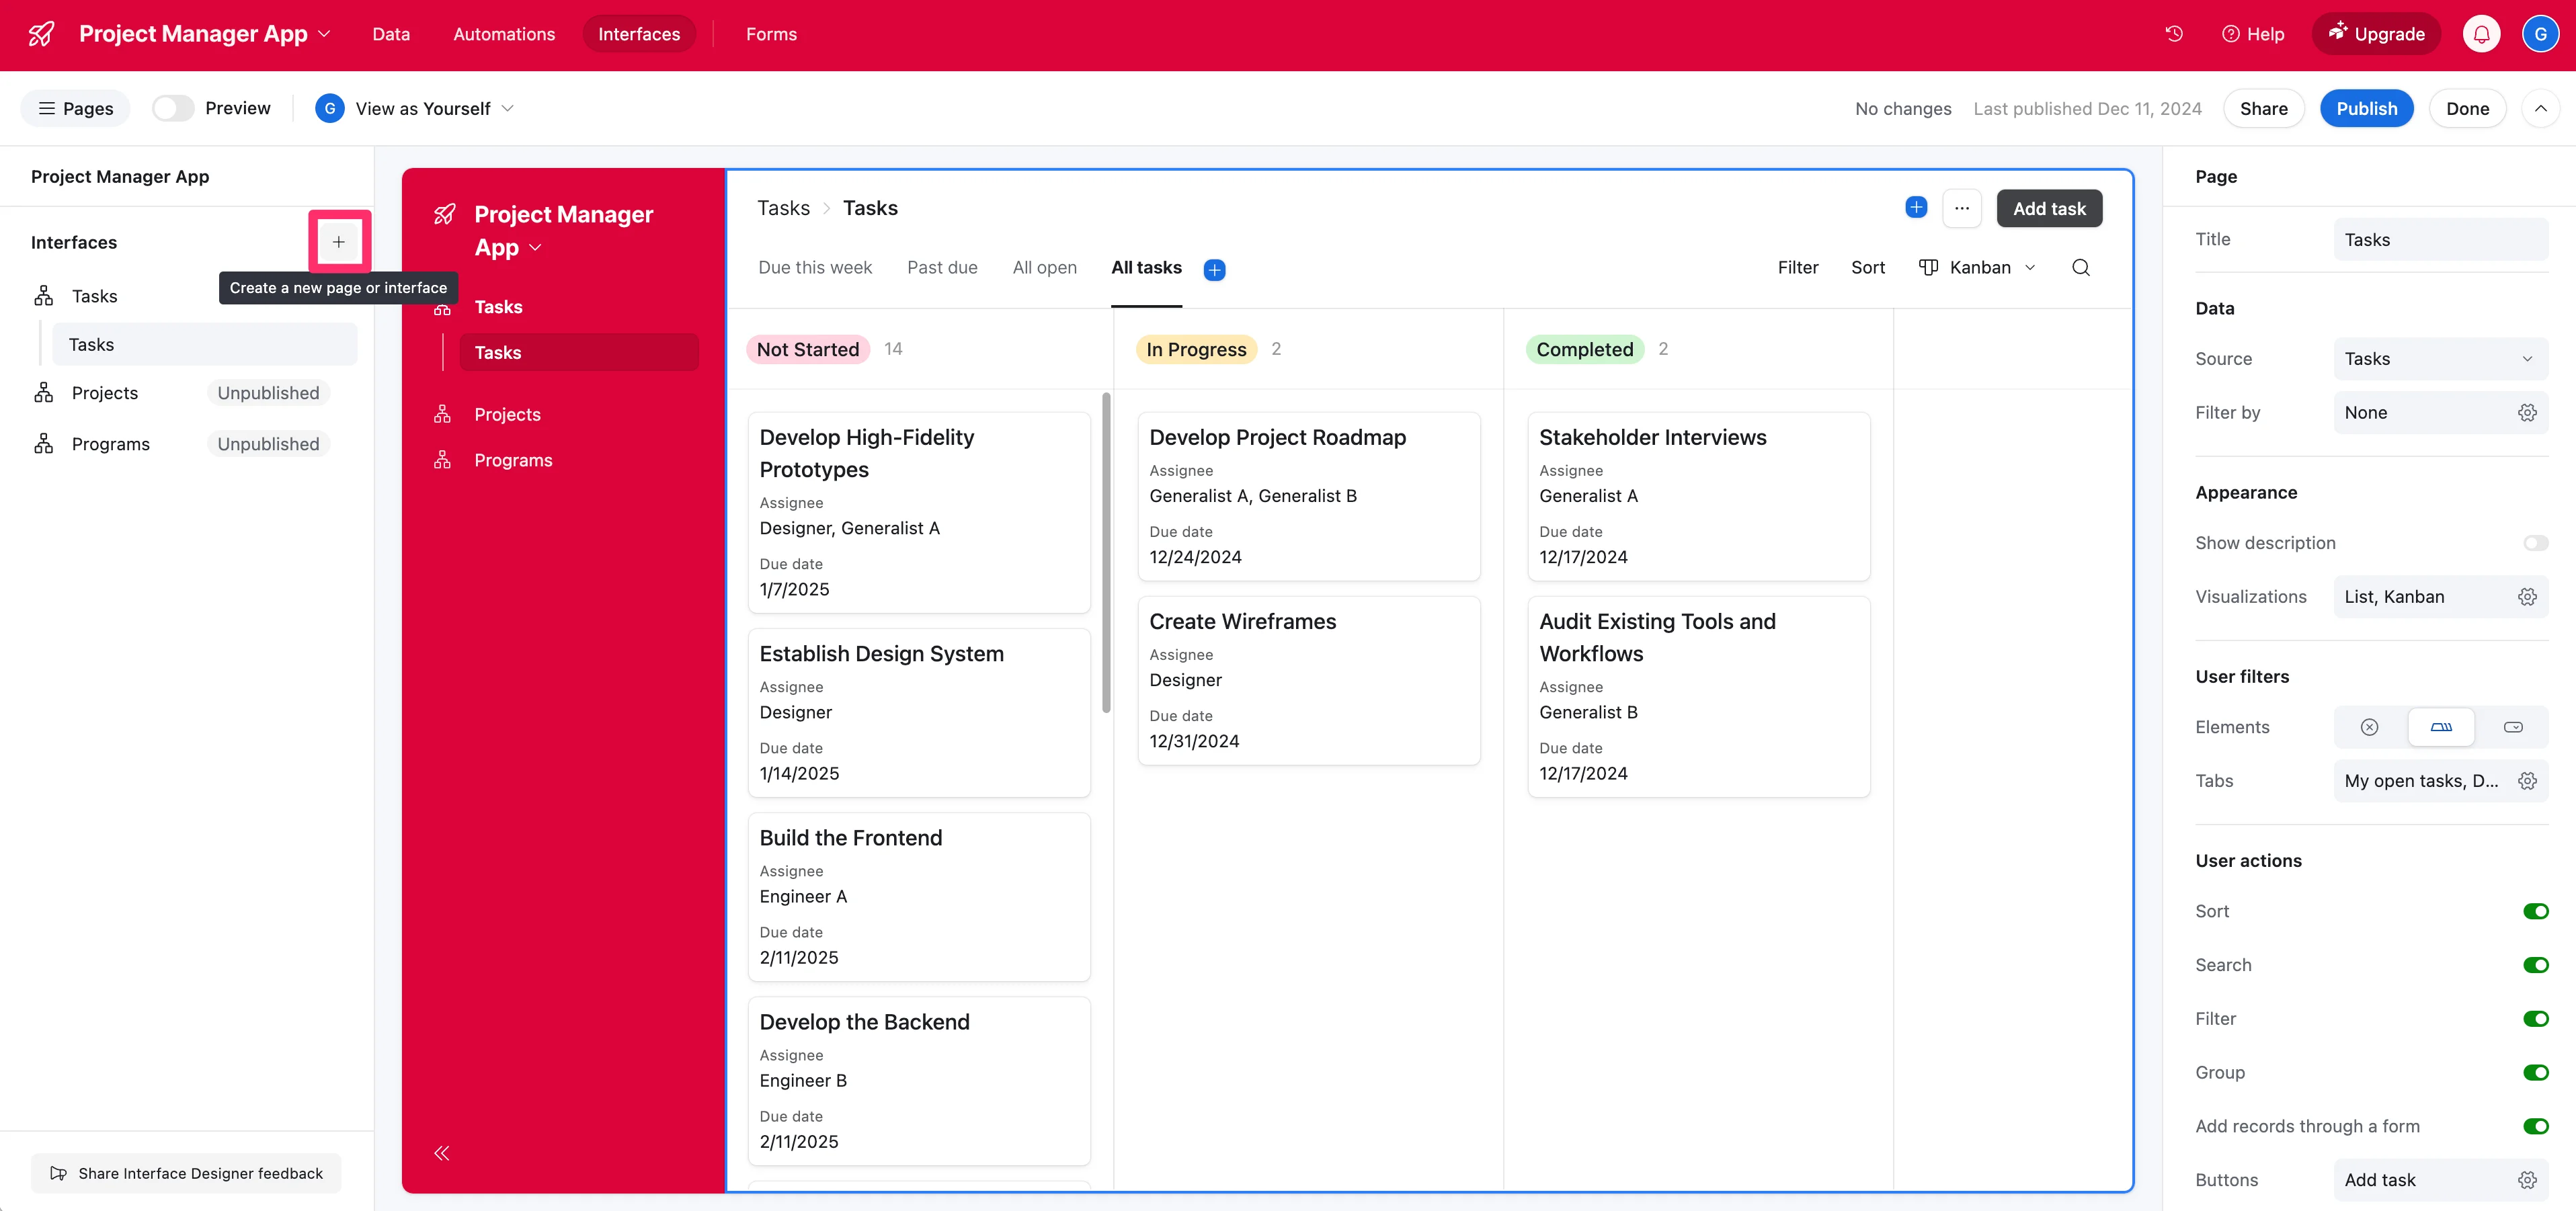
Then, click the “+” button in the sidebar by the Interfaces list.
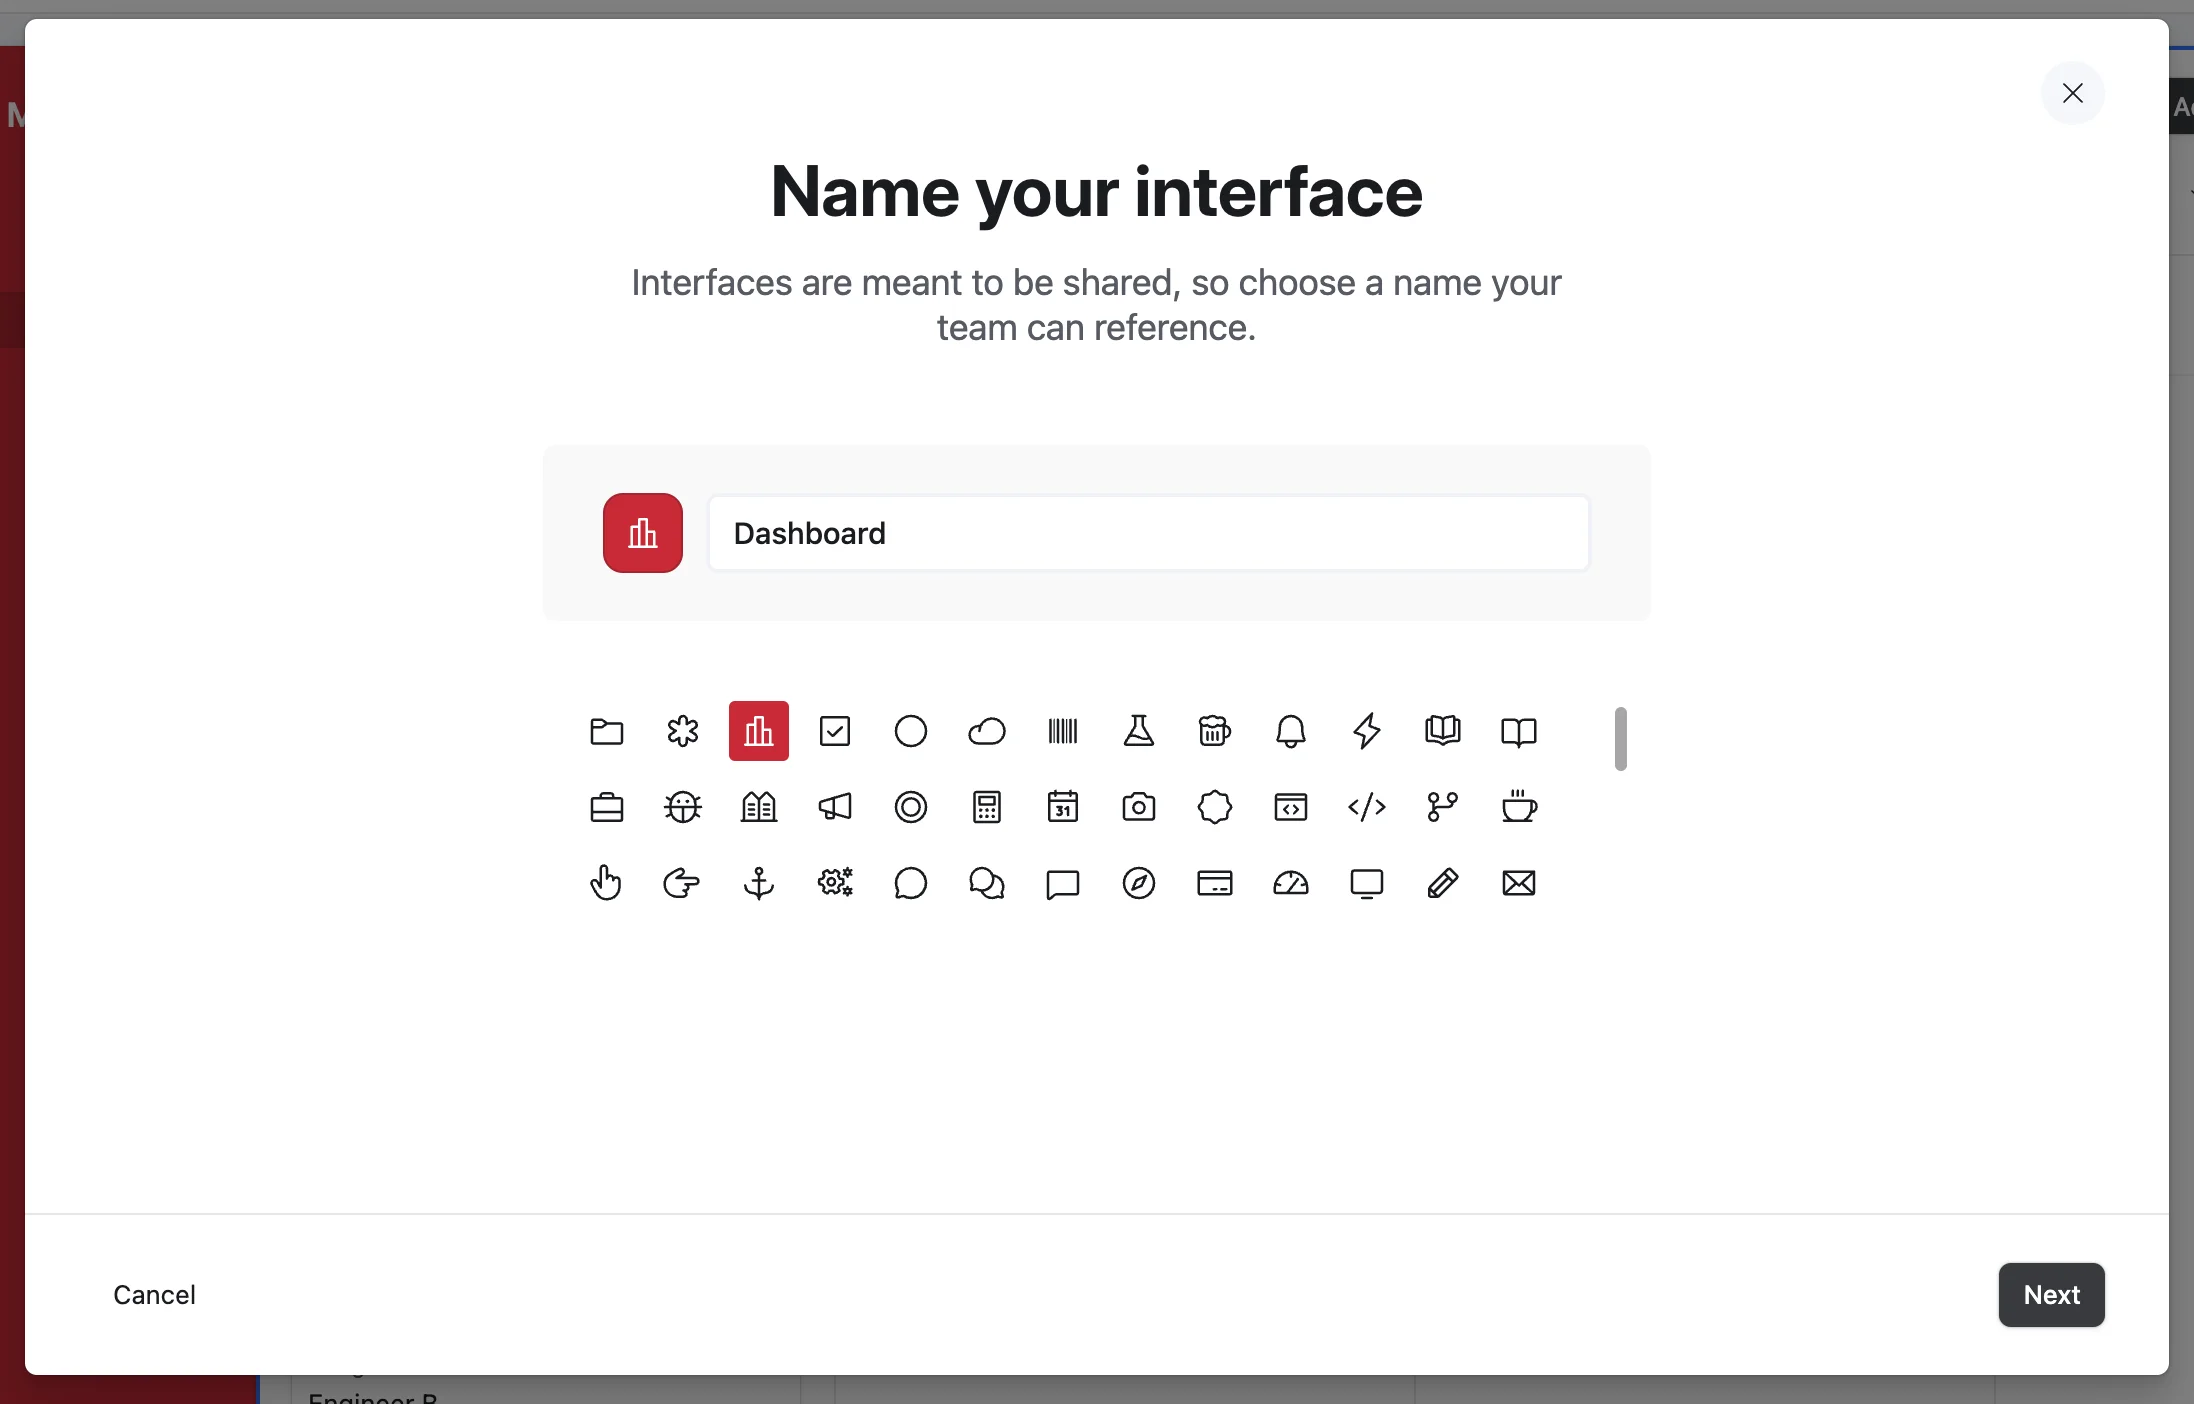
We’ll name our new interface “Dashboard” and select an icon for the page.
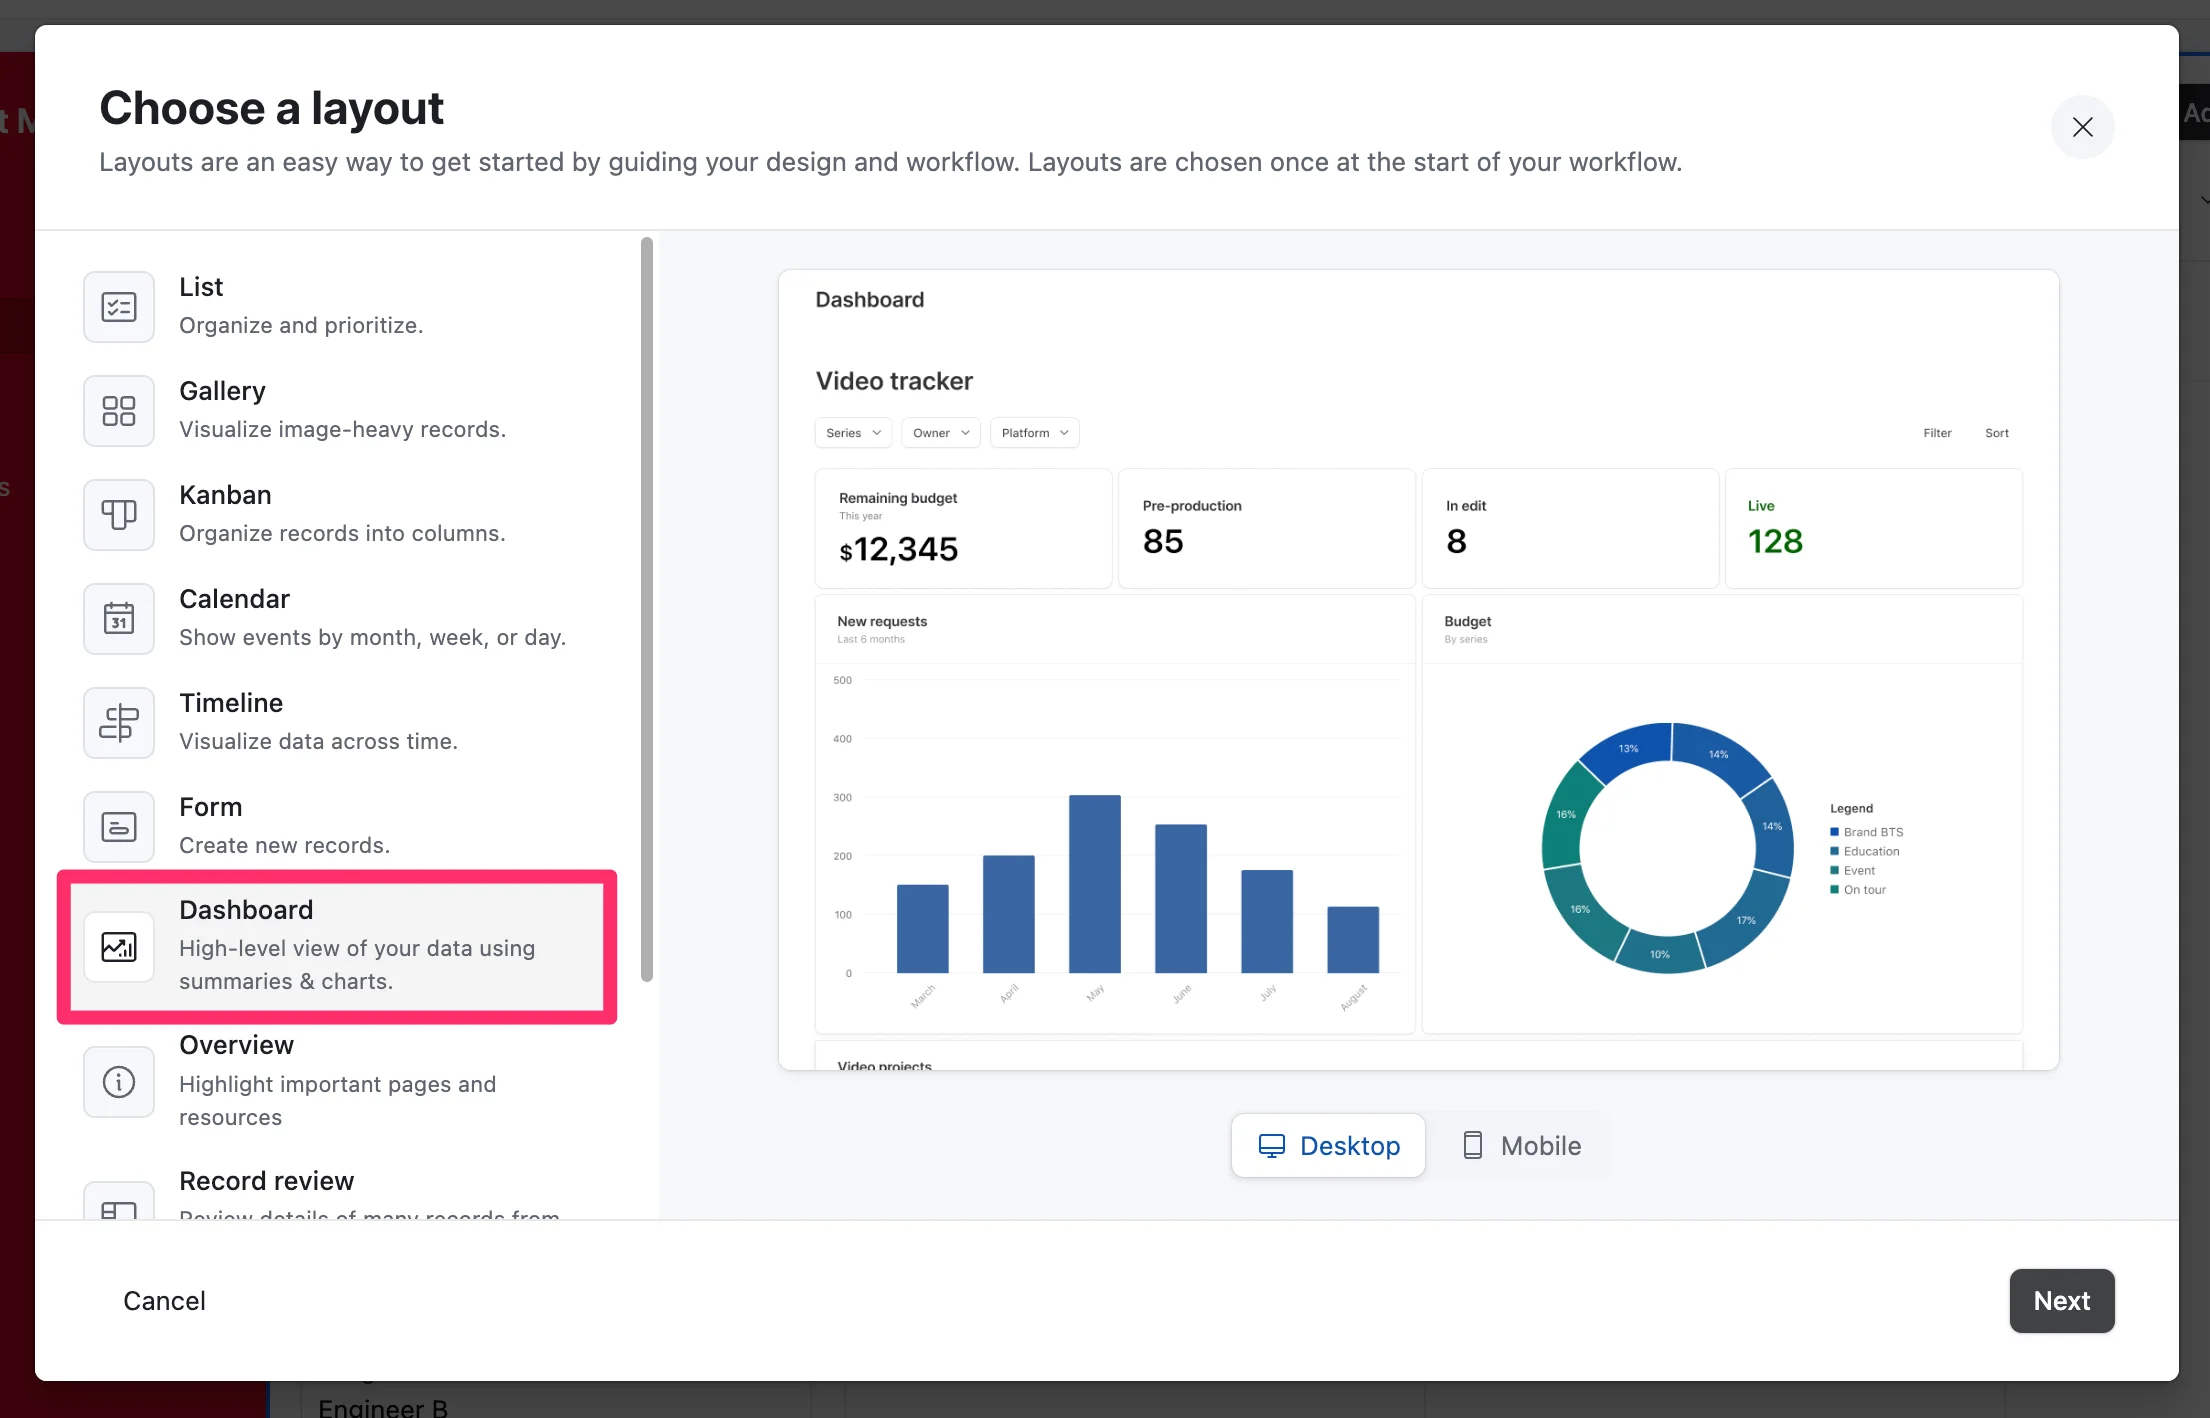
Then, we’ll select the “Dashboard” layout.
Finally, we’ll connect our “Tasks” table to the interface to wire up the data.
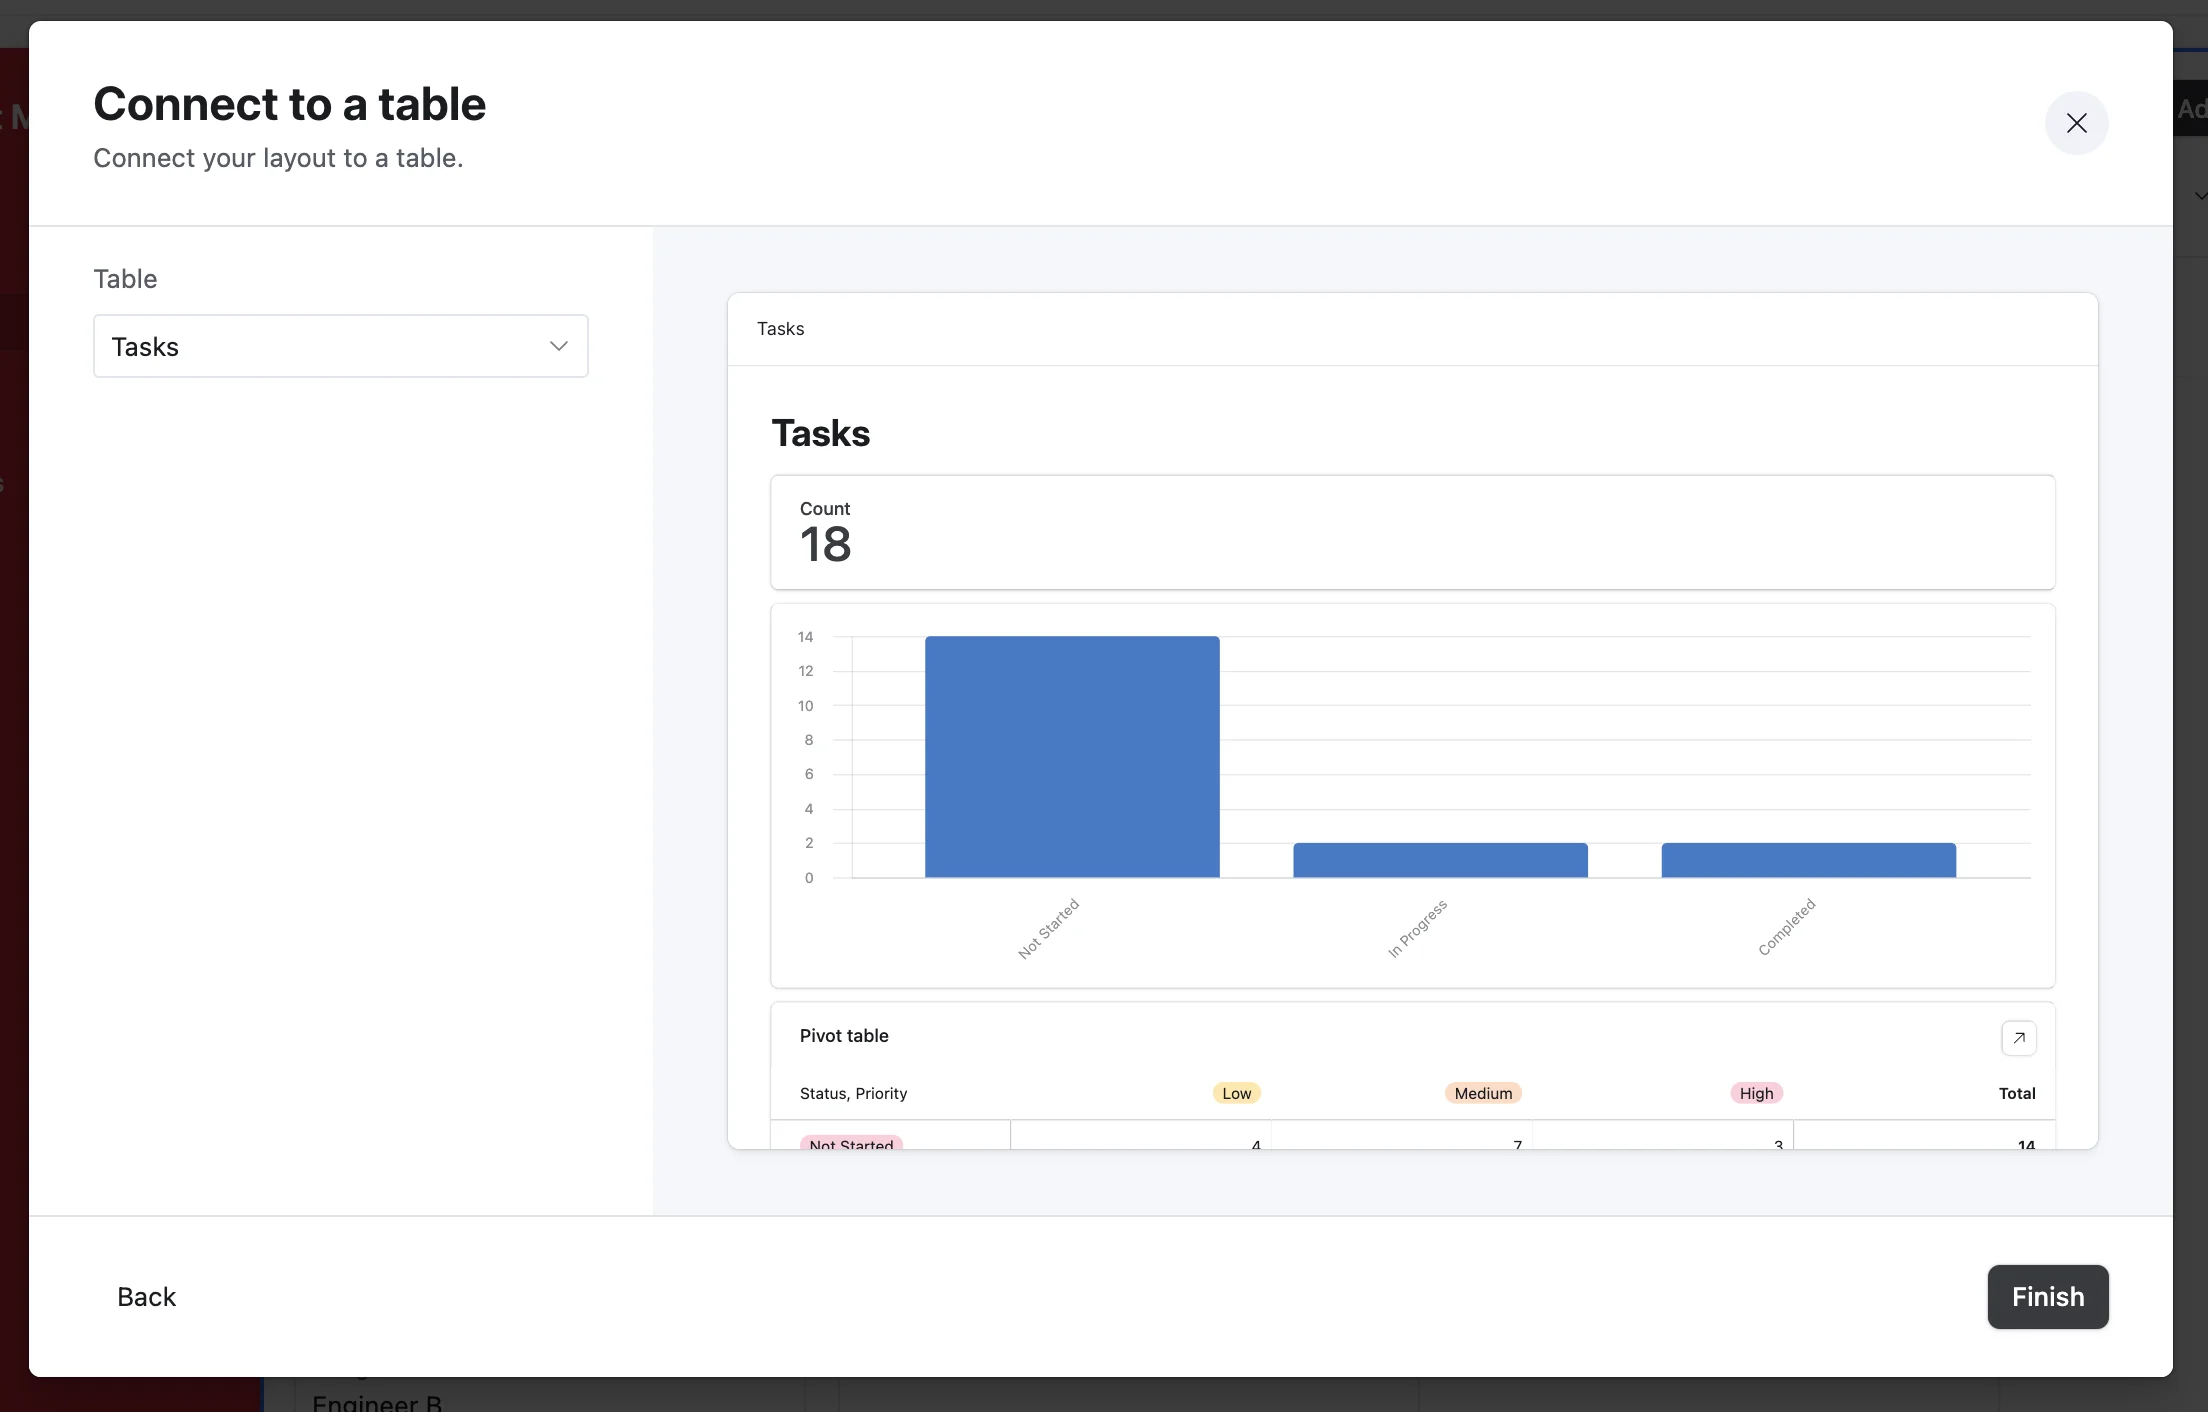
This will create a simplistic reporting dashboard of our project task data. You can add more filters, data visualizations, and components in the right-side page editor. When you’re happy with your dashboard, click the “Publish” button in the top right corner of the page.
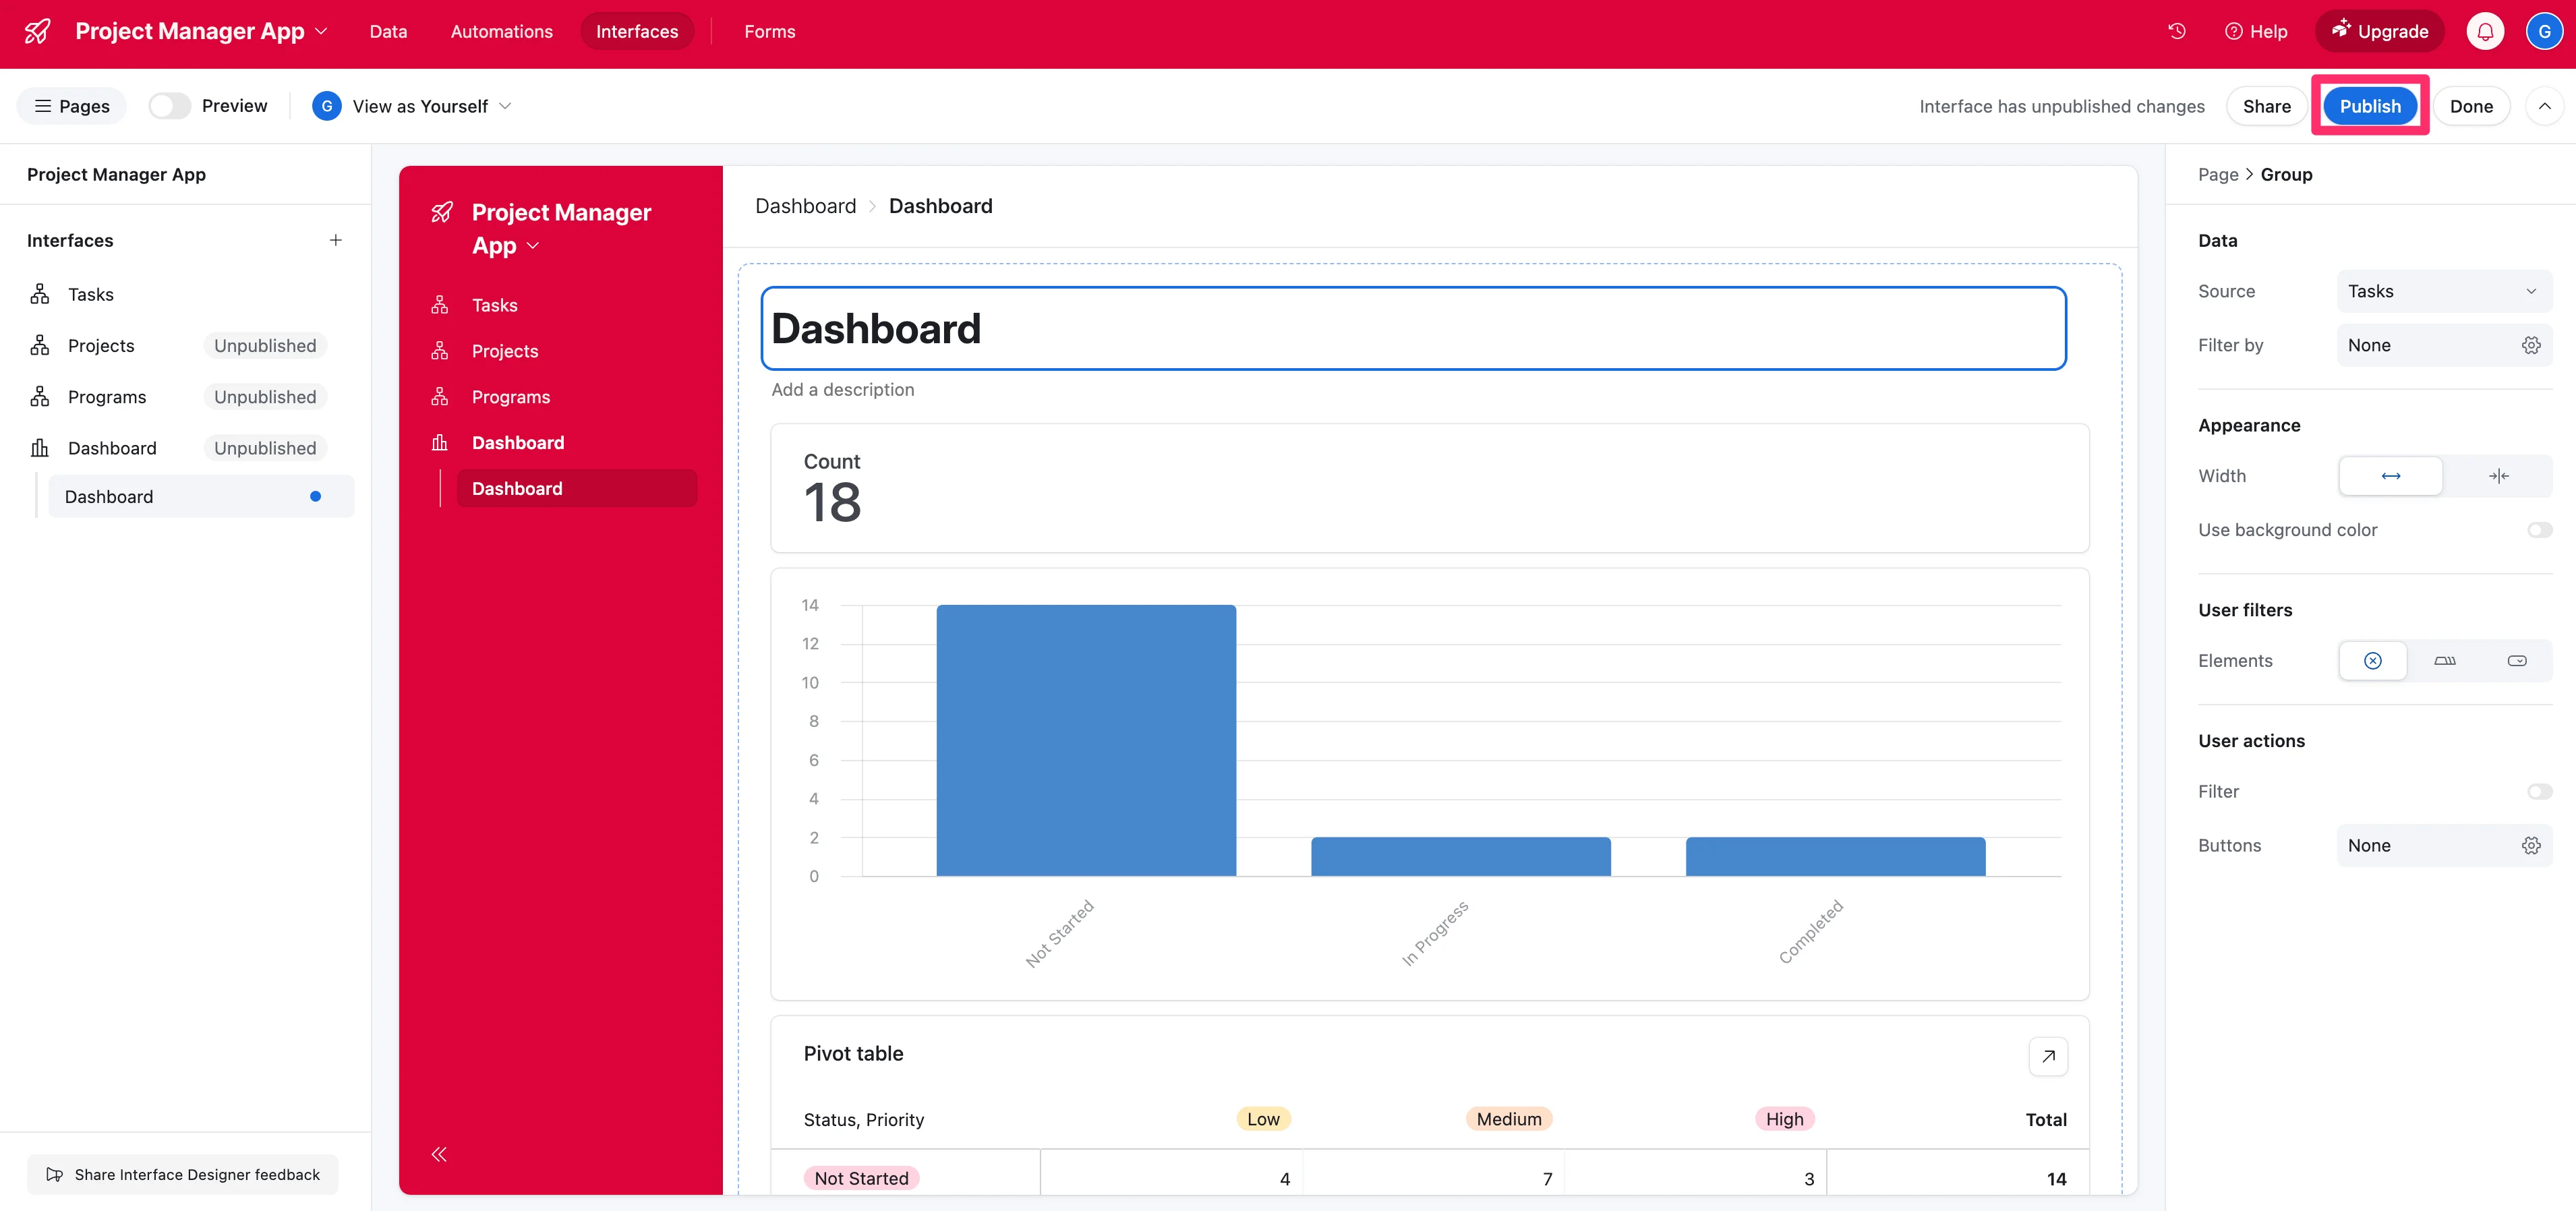
You’ll land on a new “Dashboard” page with all of the reporting. You can share this with stakeholders, executives, and project partners.

That’s it! You now have a robust project management system for your project plan, with all the task details we generated from ChatGPT in the previous lesson. You can share your Task interfaces with project collaborators and share reporting views with various stakeholders.
In the next tutorial, we’ll further refine our Airtable base with AI features to enhance the task automation and workflow management of your project.
This tutorial was created by Garrett.