Using ChatGPT for data visualization
Interact with, customize and download charts using ChatGPT’s expanded view.
2024-11-13
ChatGPT is incredibly powerful, even if you’re not using its most advanced features. From generating code to answering questions, there’s a reason it’s one of the fastest-growing consumer apps of all time.
However, you can unlock even more utility with some of ChatGPT’s newest, advanced features. In this tutorial, we’ll cover connecting 3rd party apps (e.g. Google Drive) to ChatGPT and using advanced analytics to interact and customize data with charts.
You’ll need:
- ChatGPT
Steps:
- Connect 3rd party data sources to ChatGPT
- Interact with charts in a new expandable view
- Customize and download charts for presentations and documents
Connect 3rd party data sources to ChatGPT
If you use a cloud-based document manager, like Google Drive or Microsoft OneDrive, then chatting with those documents in ChatGPT has gotten much easier. Now when you click the attachment button to upload a file, you can choose to select a document from either Google Drive or Microsoft OneDrive.
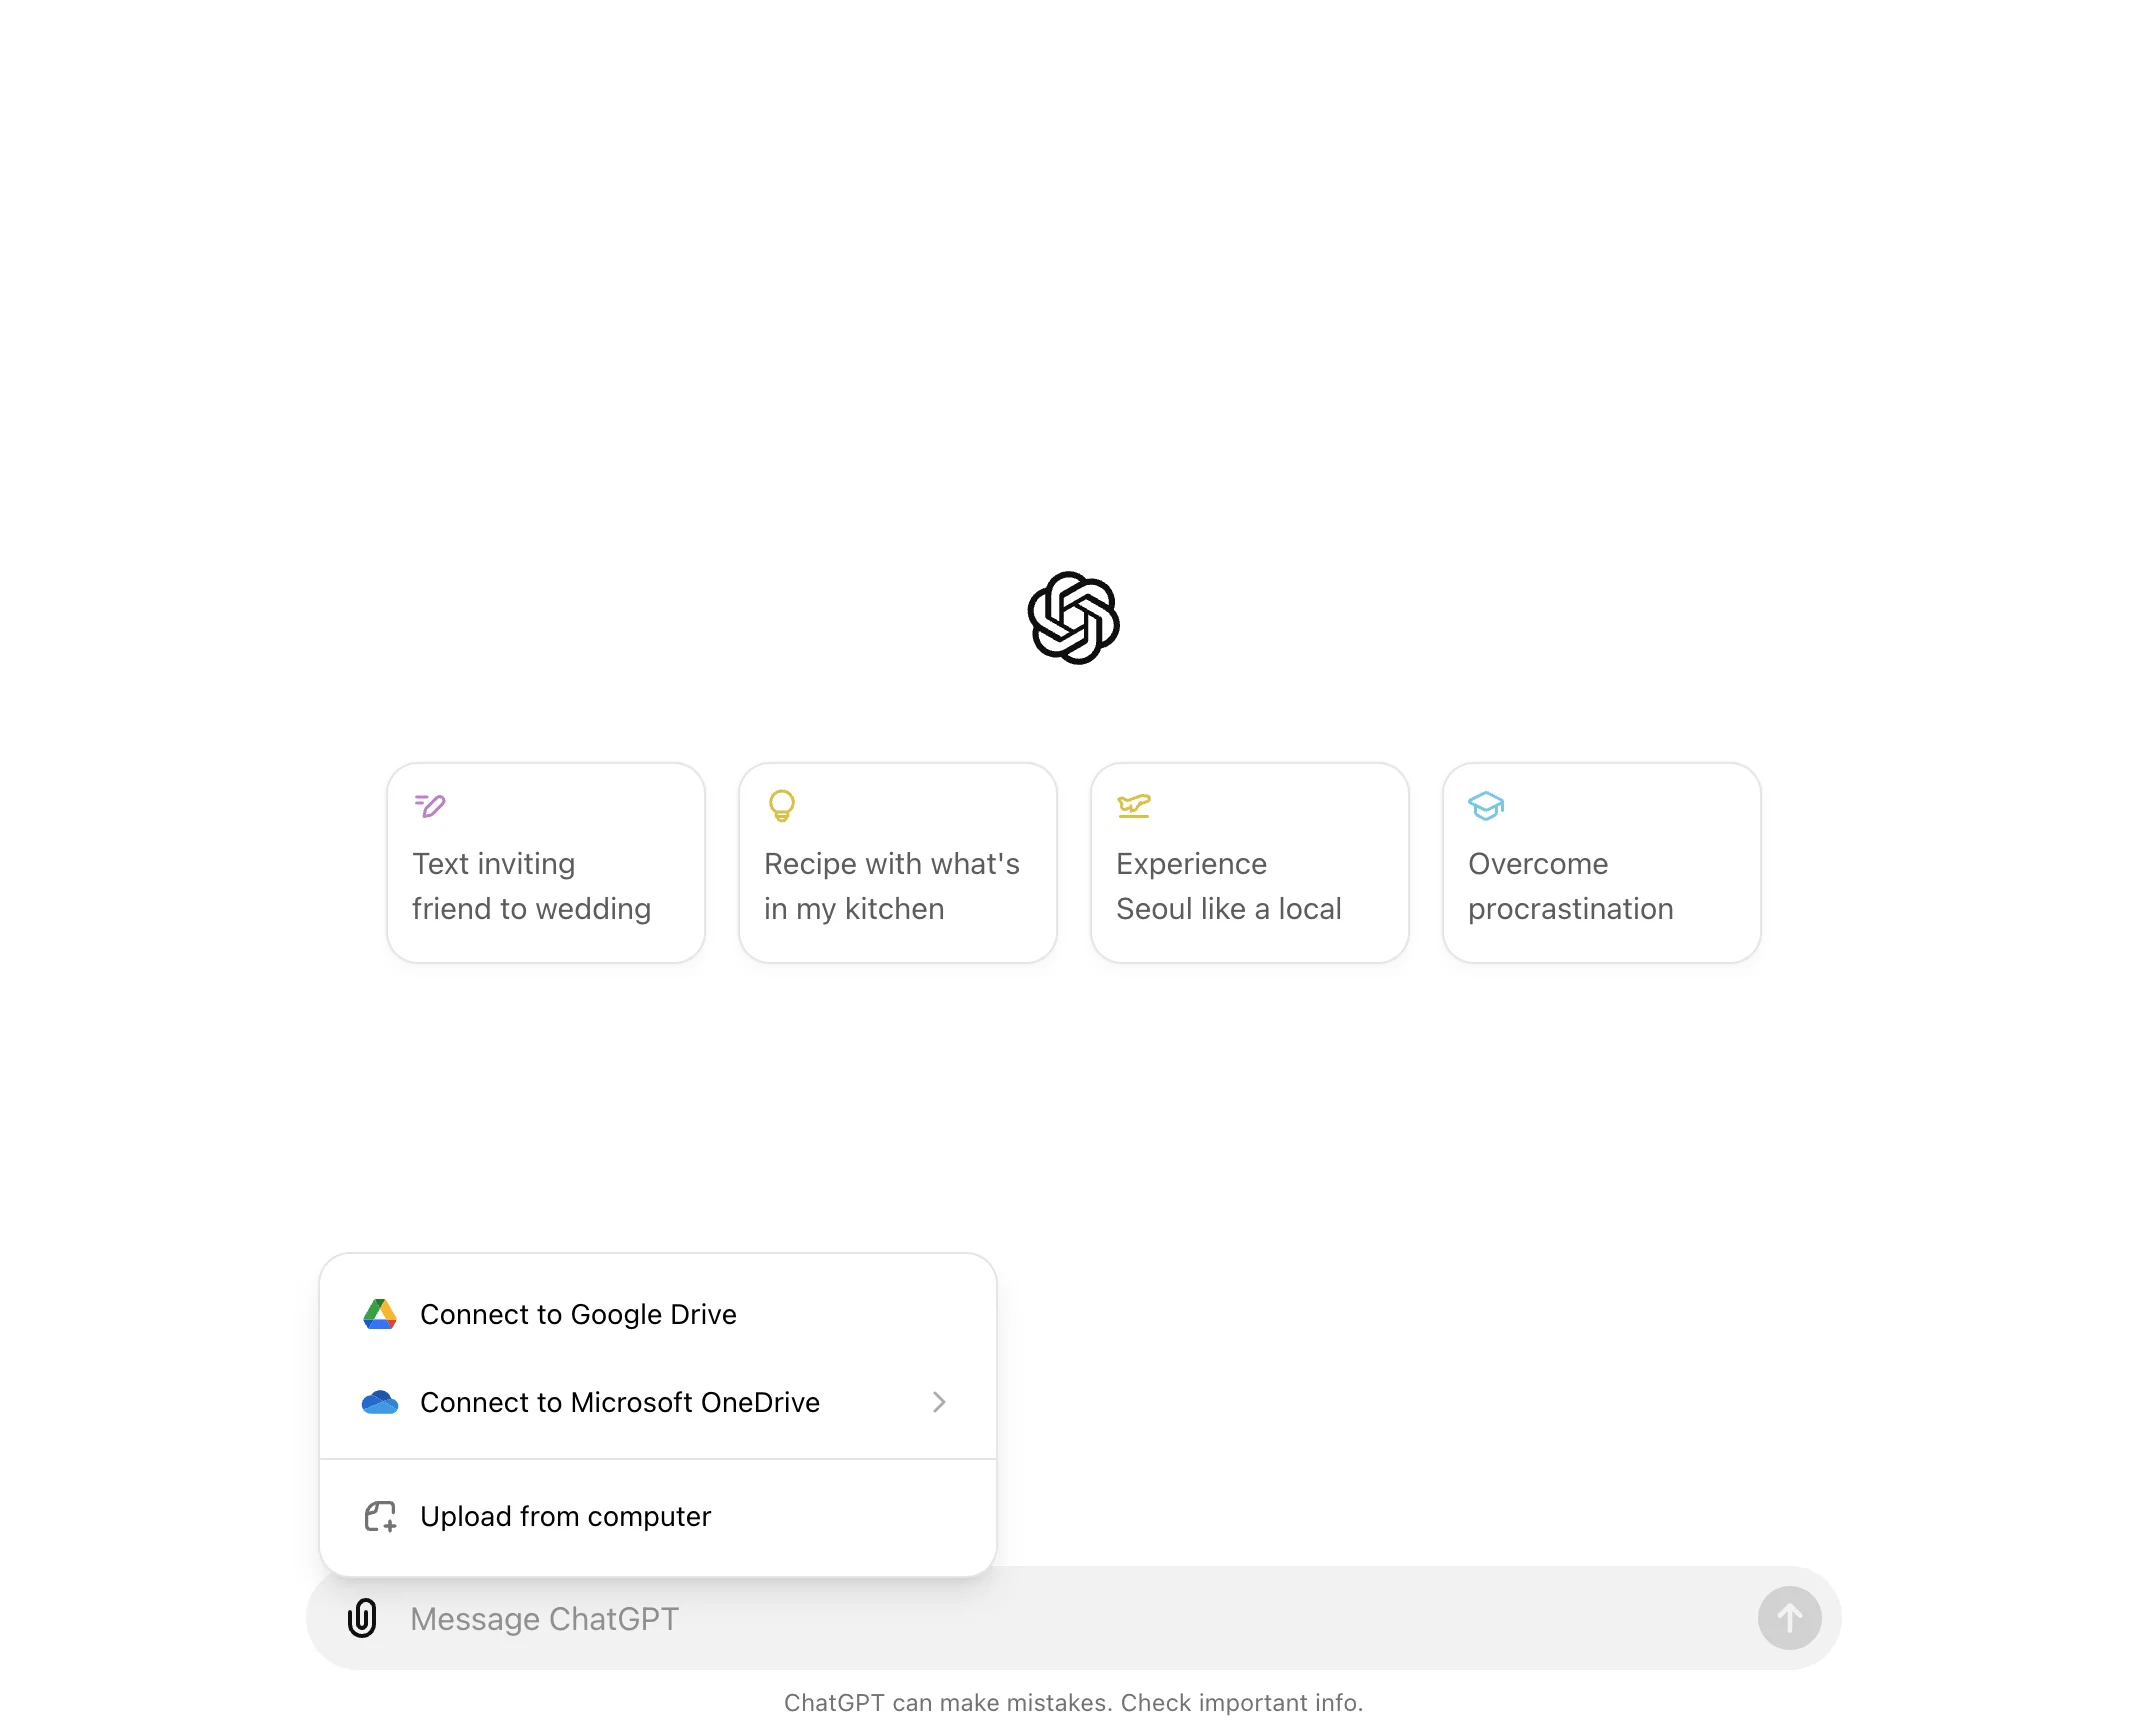
We’ll go with connecting our Google Drive to ChatGPT. To do this, click on the “Connect to Google Drive” button on the attachment pop-up. If you haven’t authenticated the connection, you’ll be prompted to authenticate the application. Go through that process and you’ll be navigated back to ChatGPT with an open Google Drive modal.
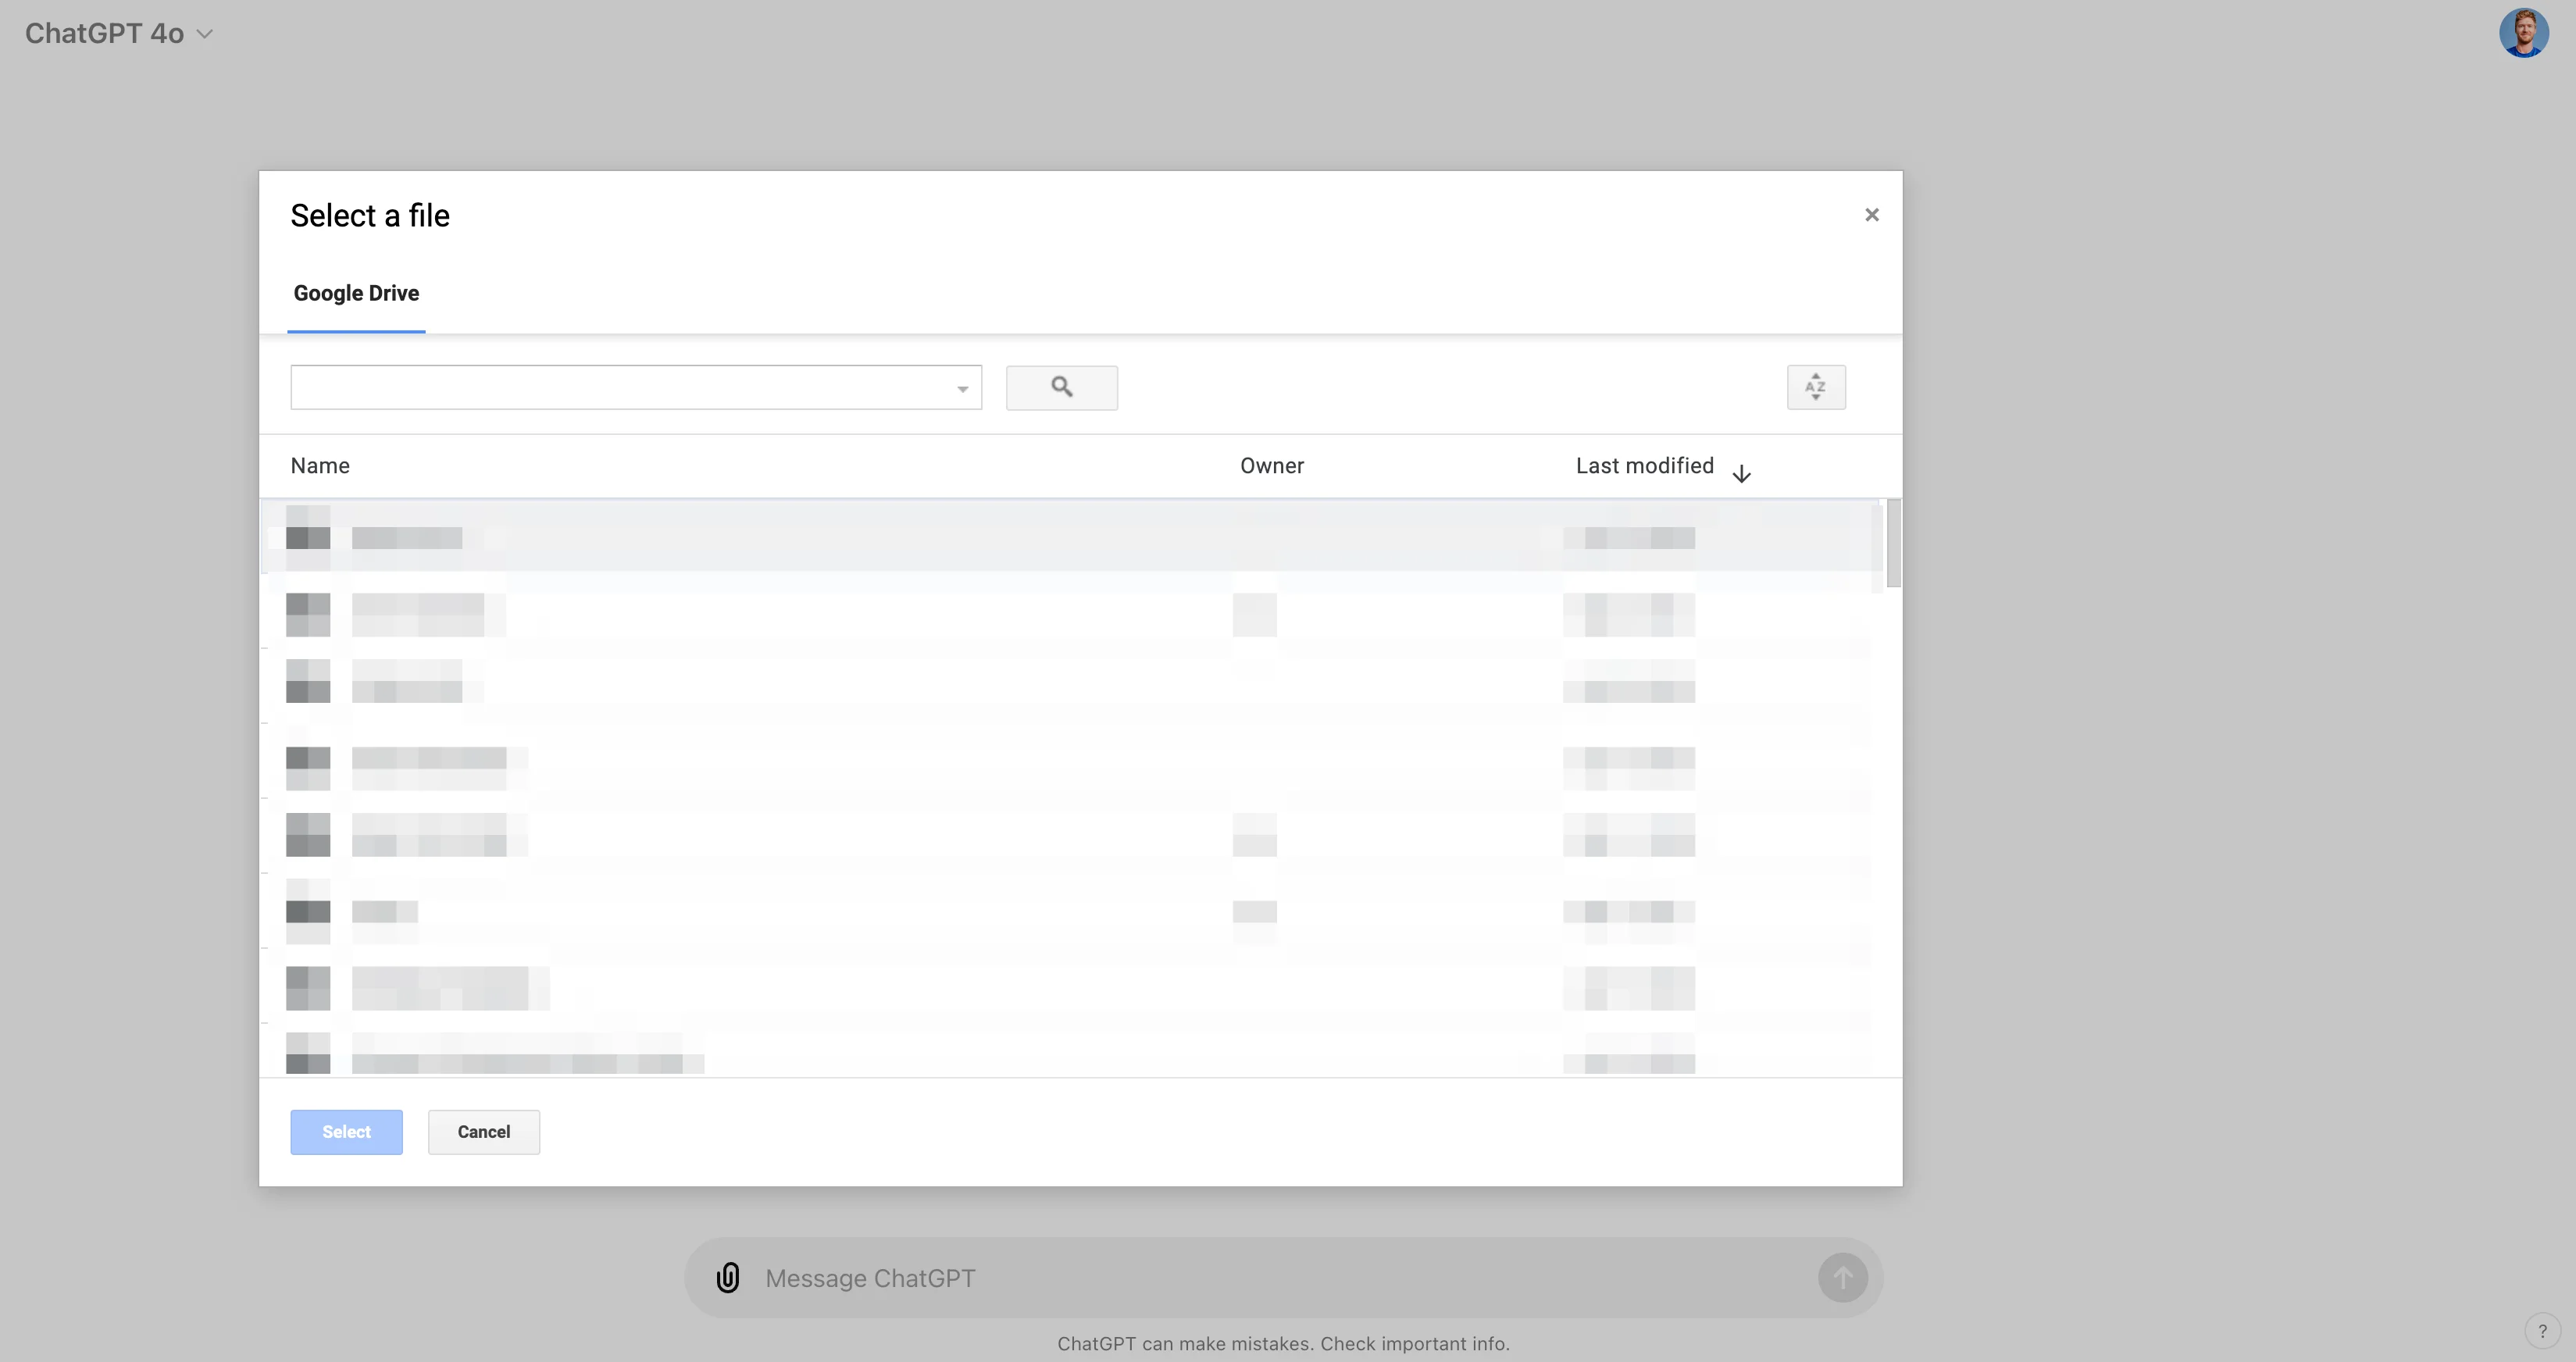
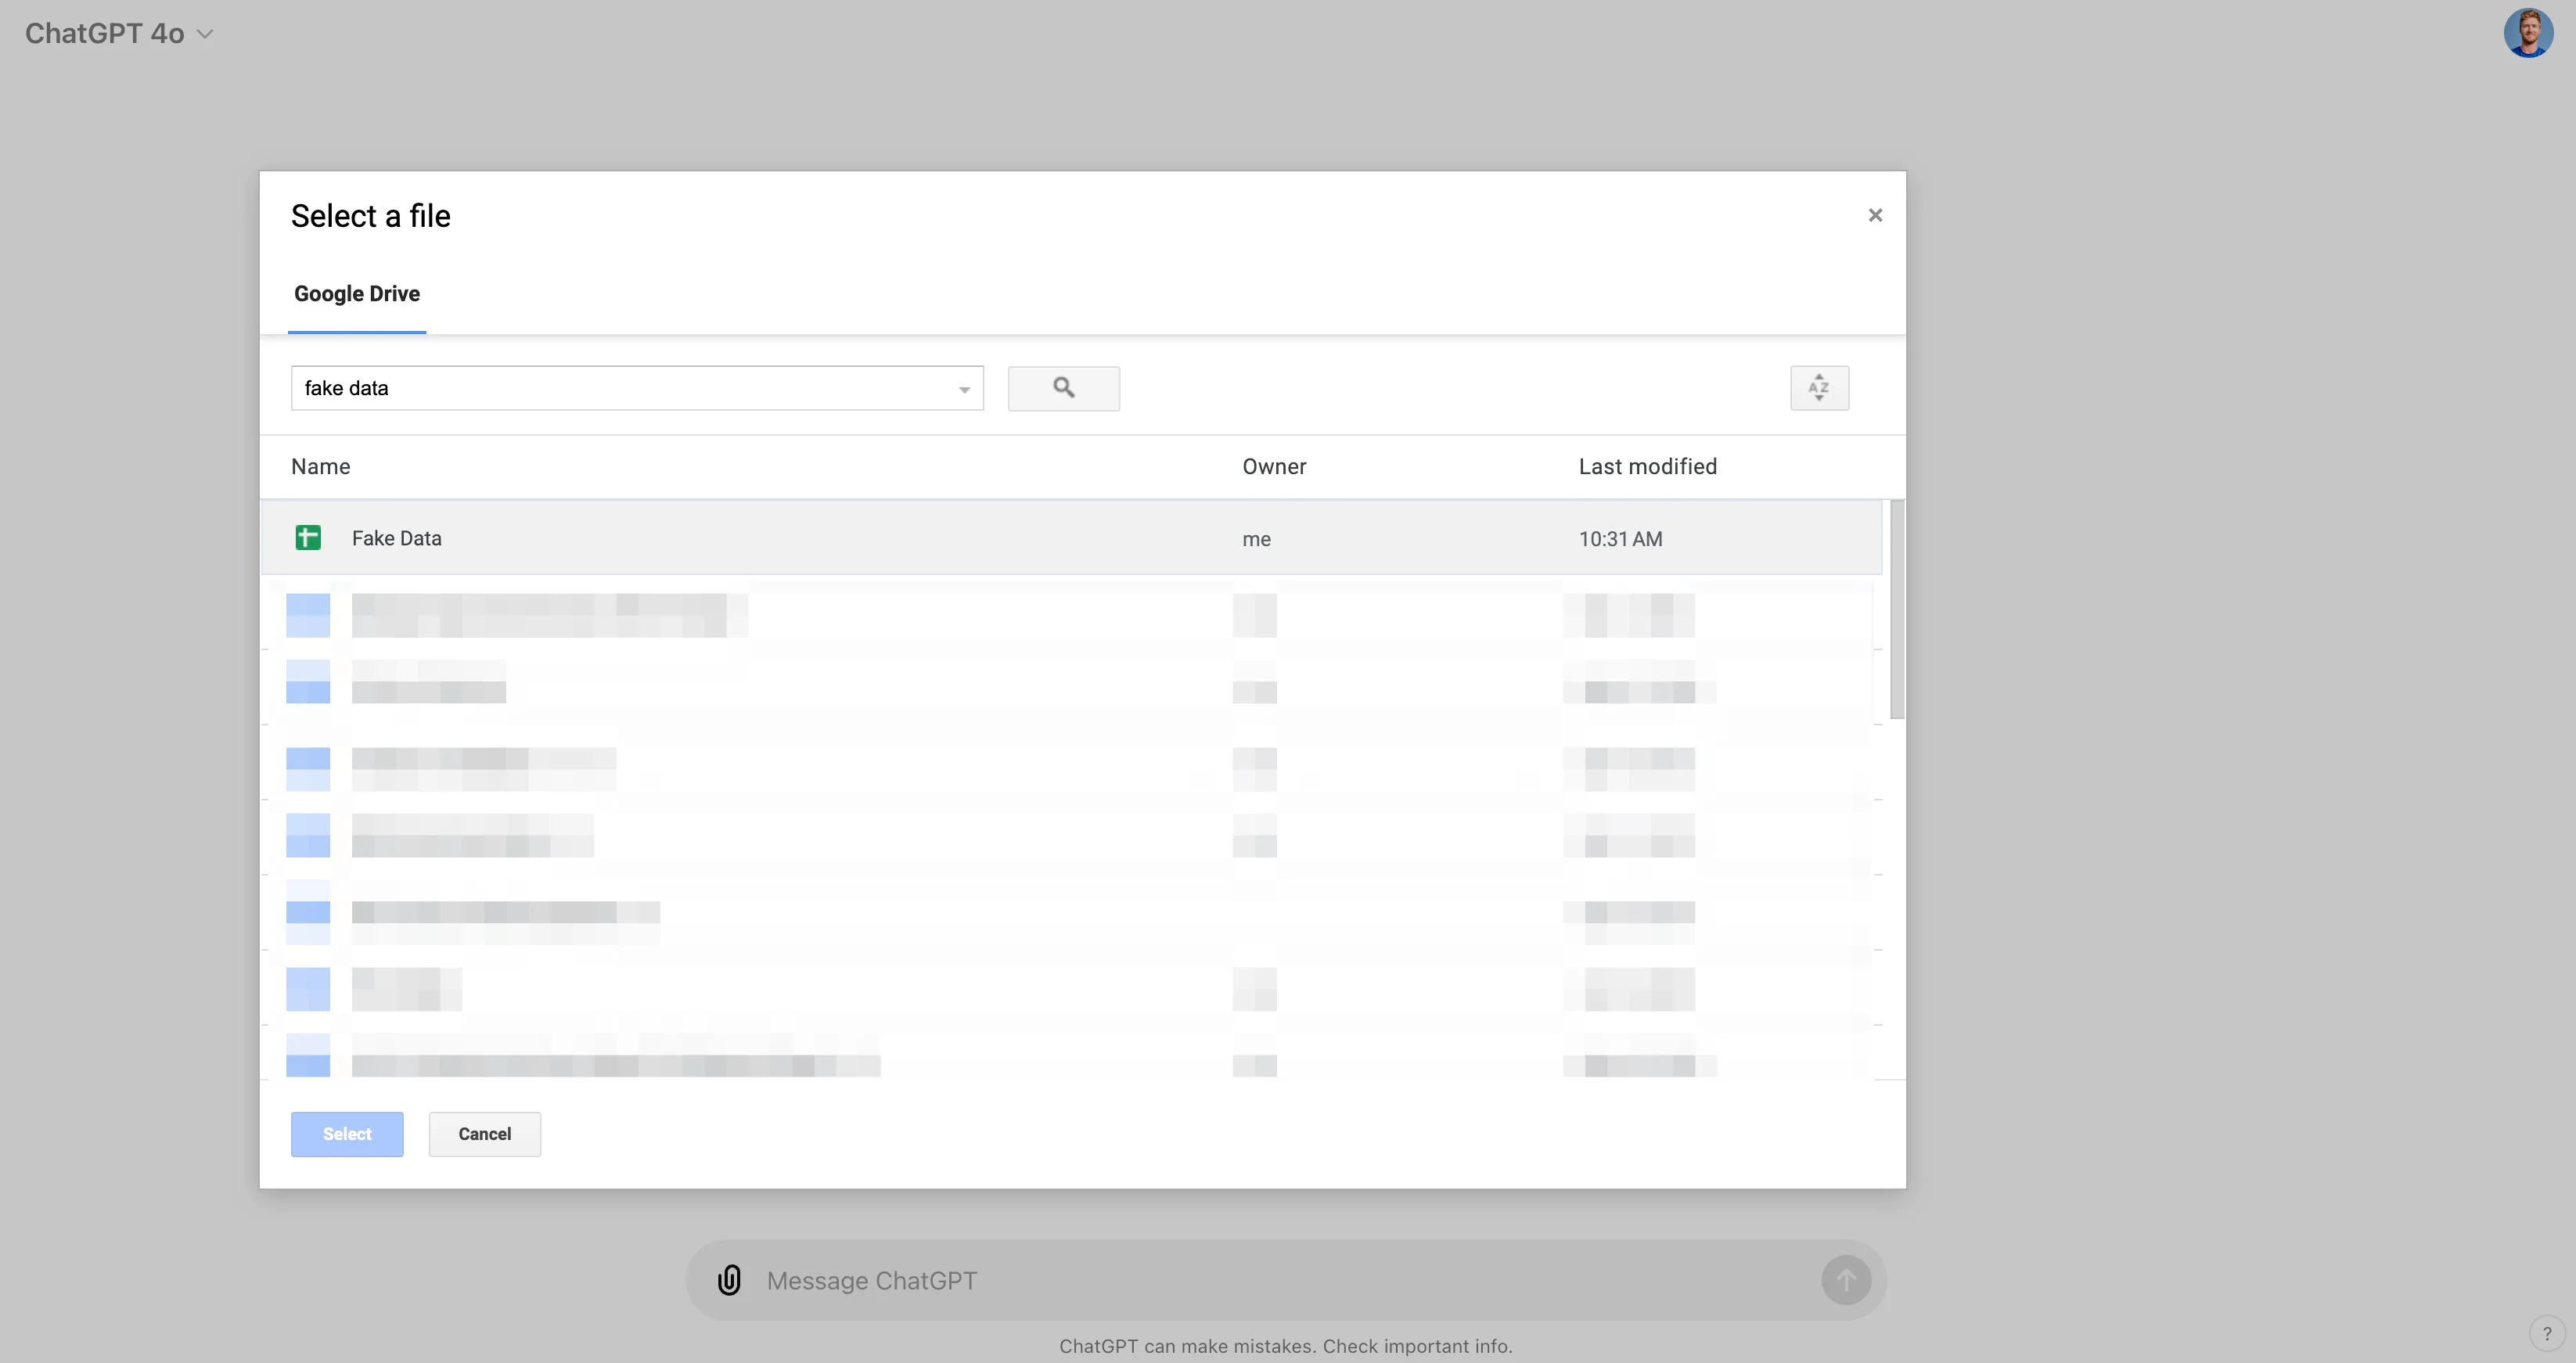
We’ll search for a file called “Fake Data” within our Google Drive. You can either search for documents using the search bar or click through folders in the visual window.
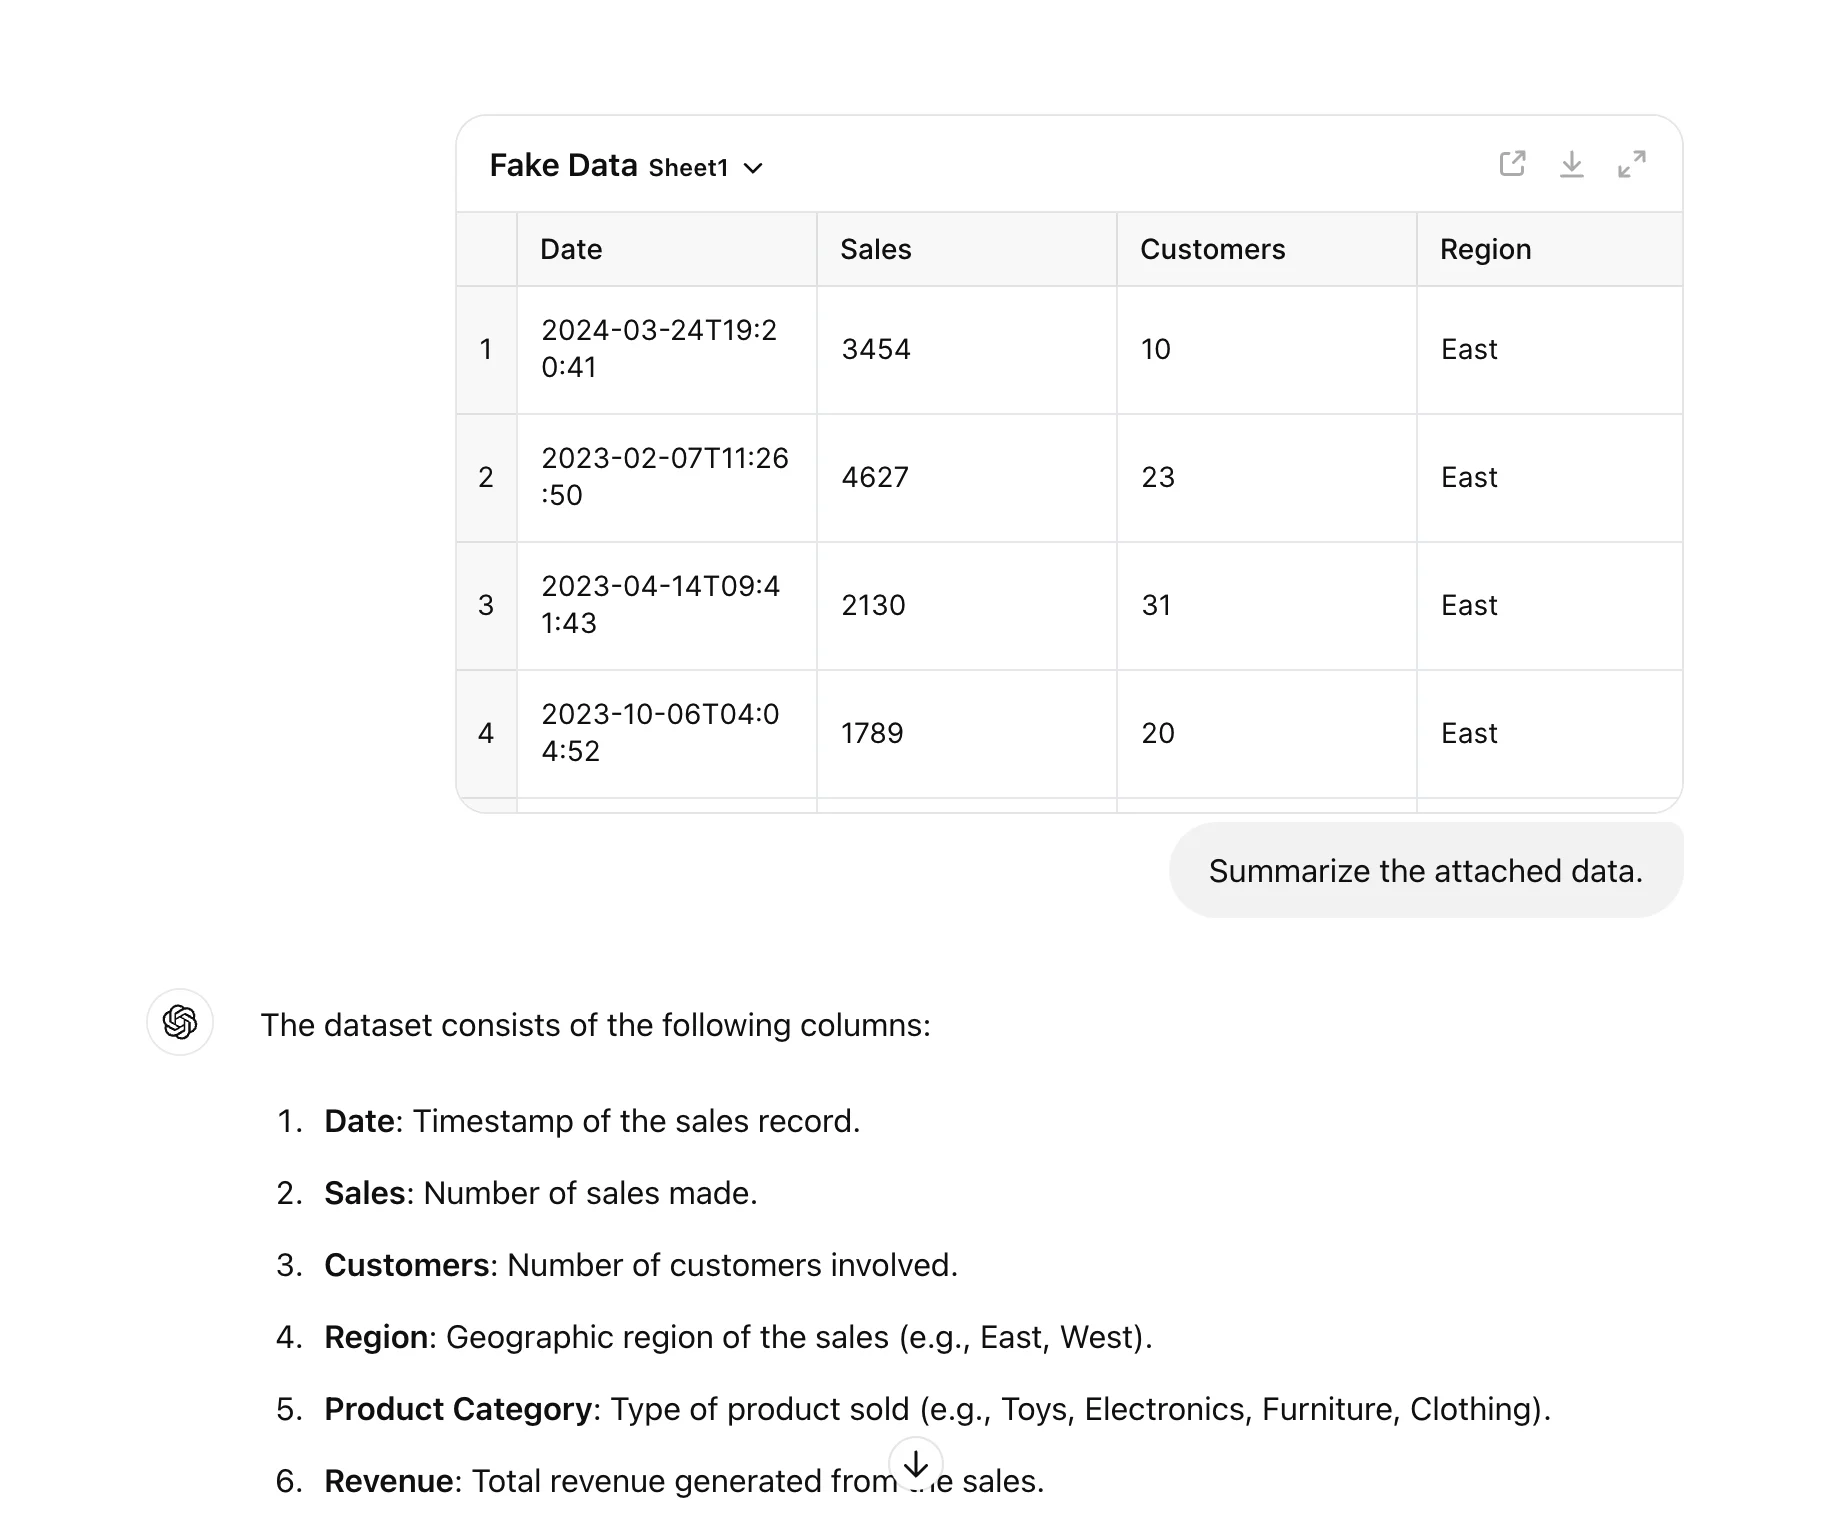
With our document selected, we can have ChatGPT summarize the data to make sure it has access and we have the right document loaded for analysis.
Sample prompt:
Summarize the attached data.
Interact with charts in a new expandable view
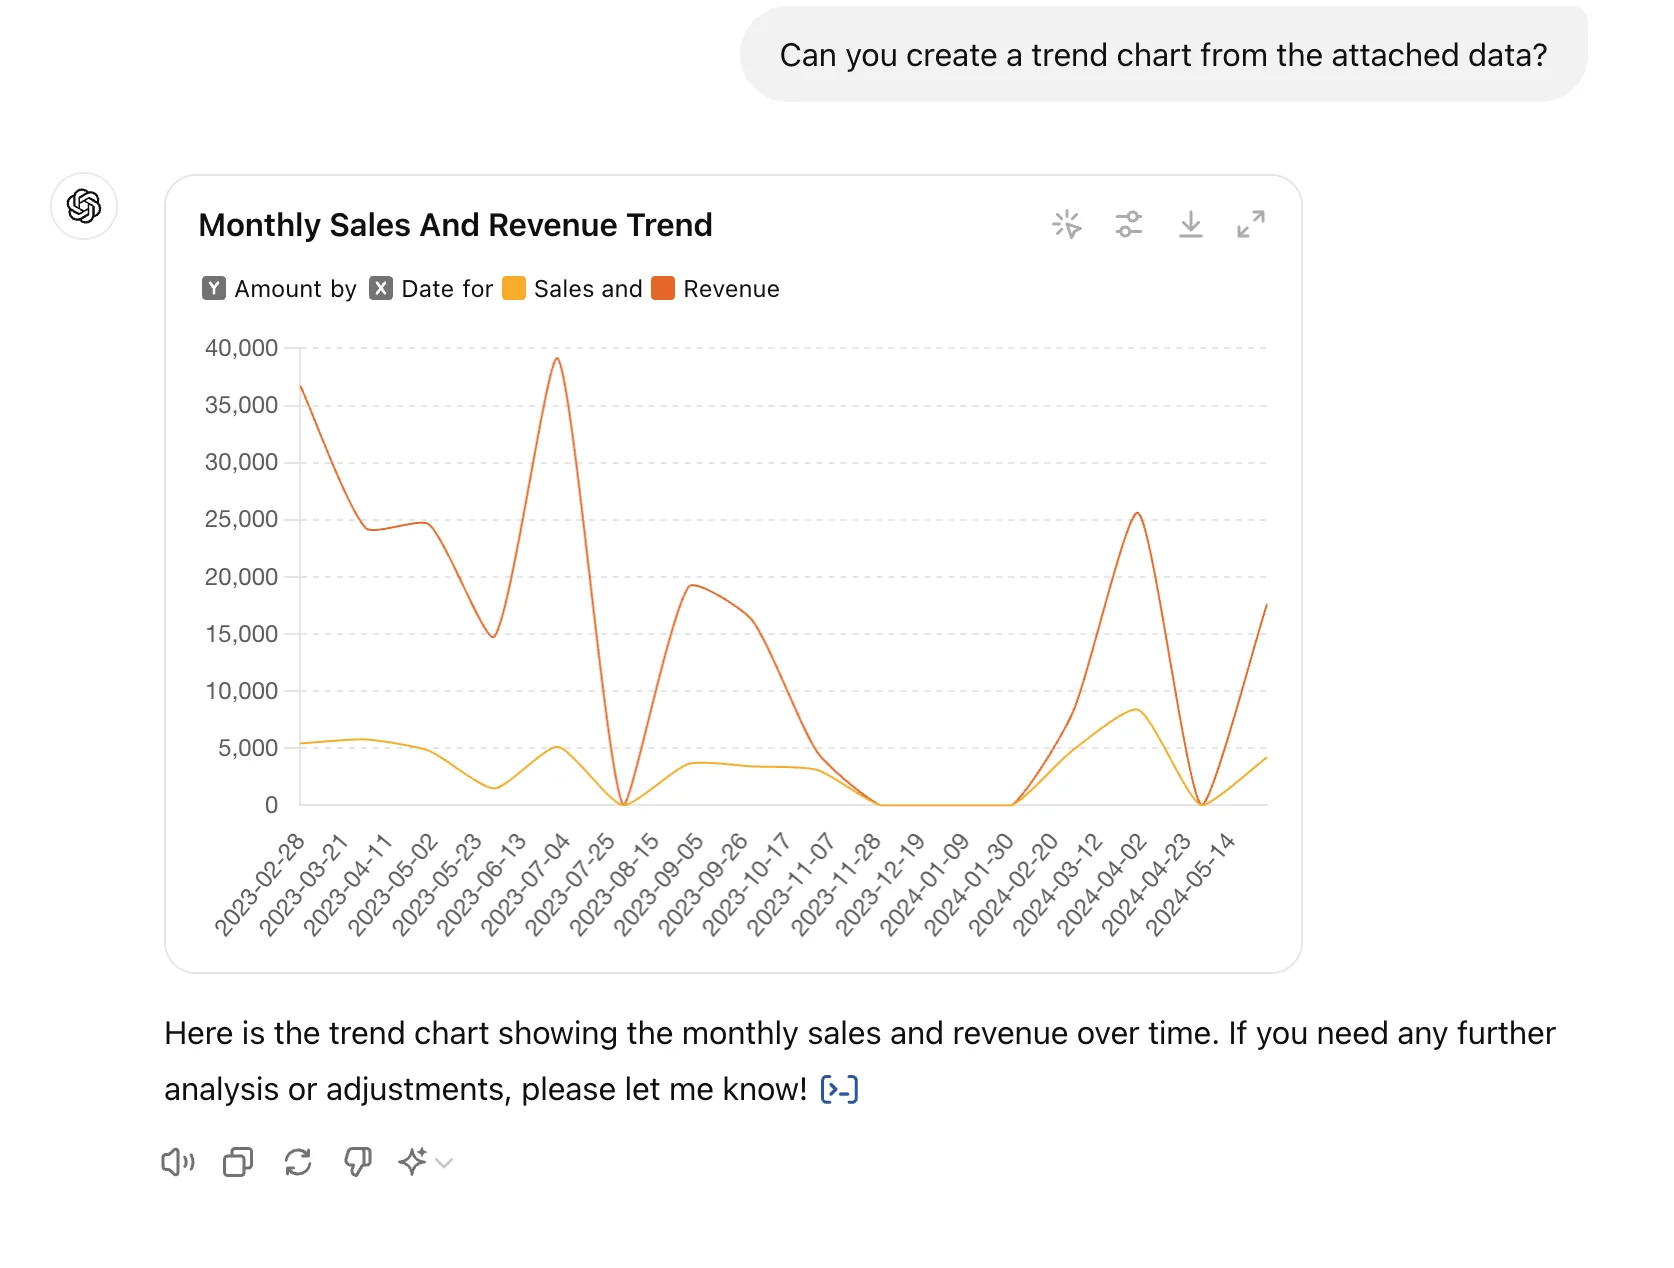
Now that we have our data loaded from Google Drive, we can start generating interactive charts within ChatGPT using the new analytics engine. We’ll start by having it create a trend chart from our data.
Sample prompt:
Can you create a [insert chart type] from the attached data?
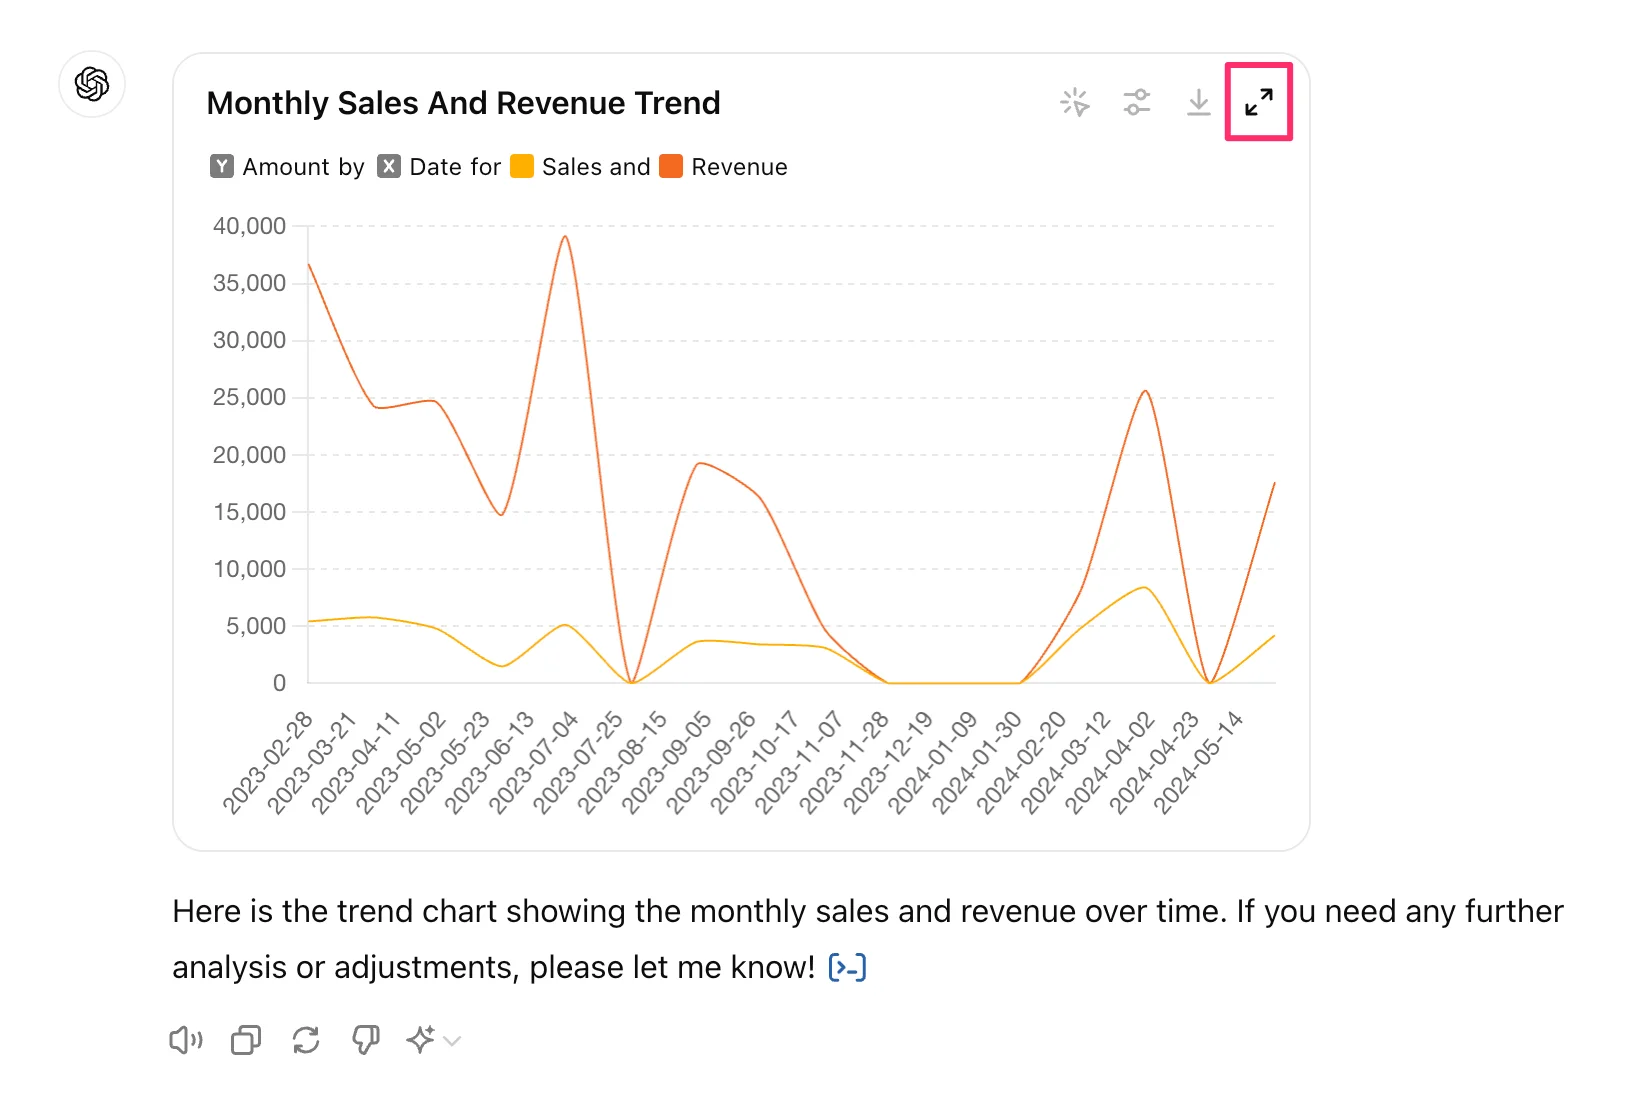
Click the expand button in the top right corner of the chart to expand the graph into a full-screen view. This is where we can start chatting with ChatGPT about the specific graph to edit specific components.
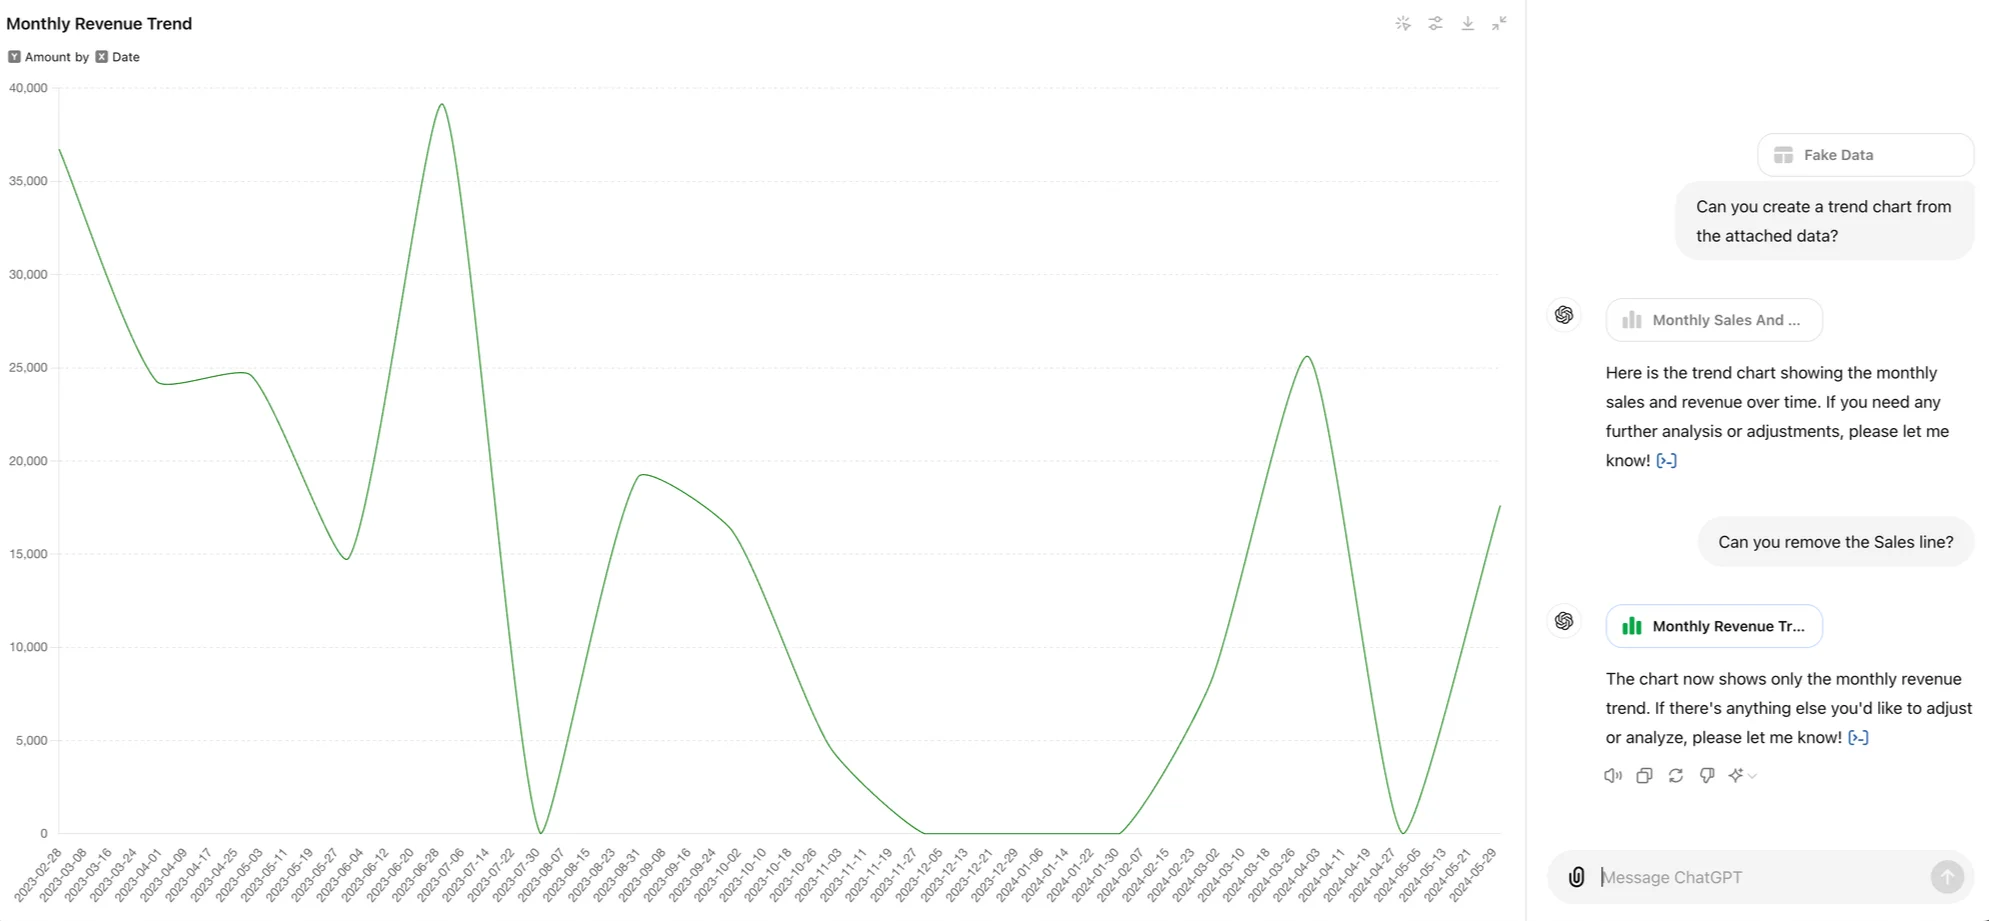
To start, we’ll remove the Sales trend line that was created in the graph by asking ChatGPT to remove it.
Sample prompt:
Can you remove the [insert variable]?
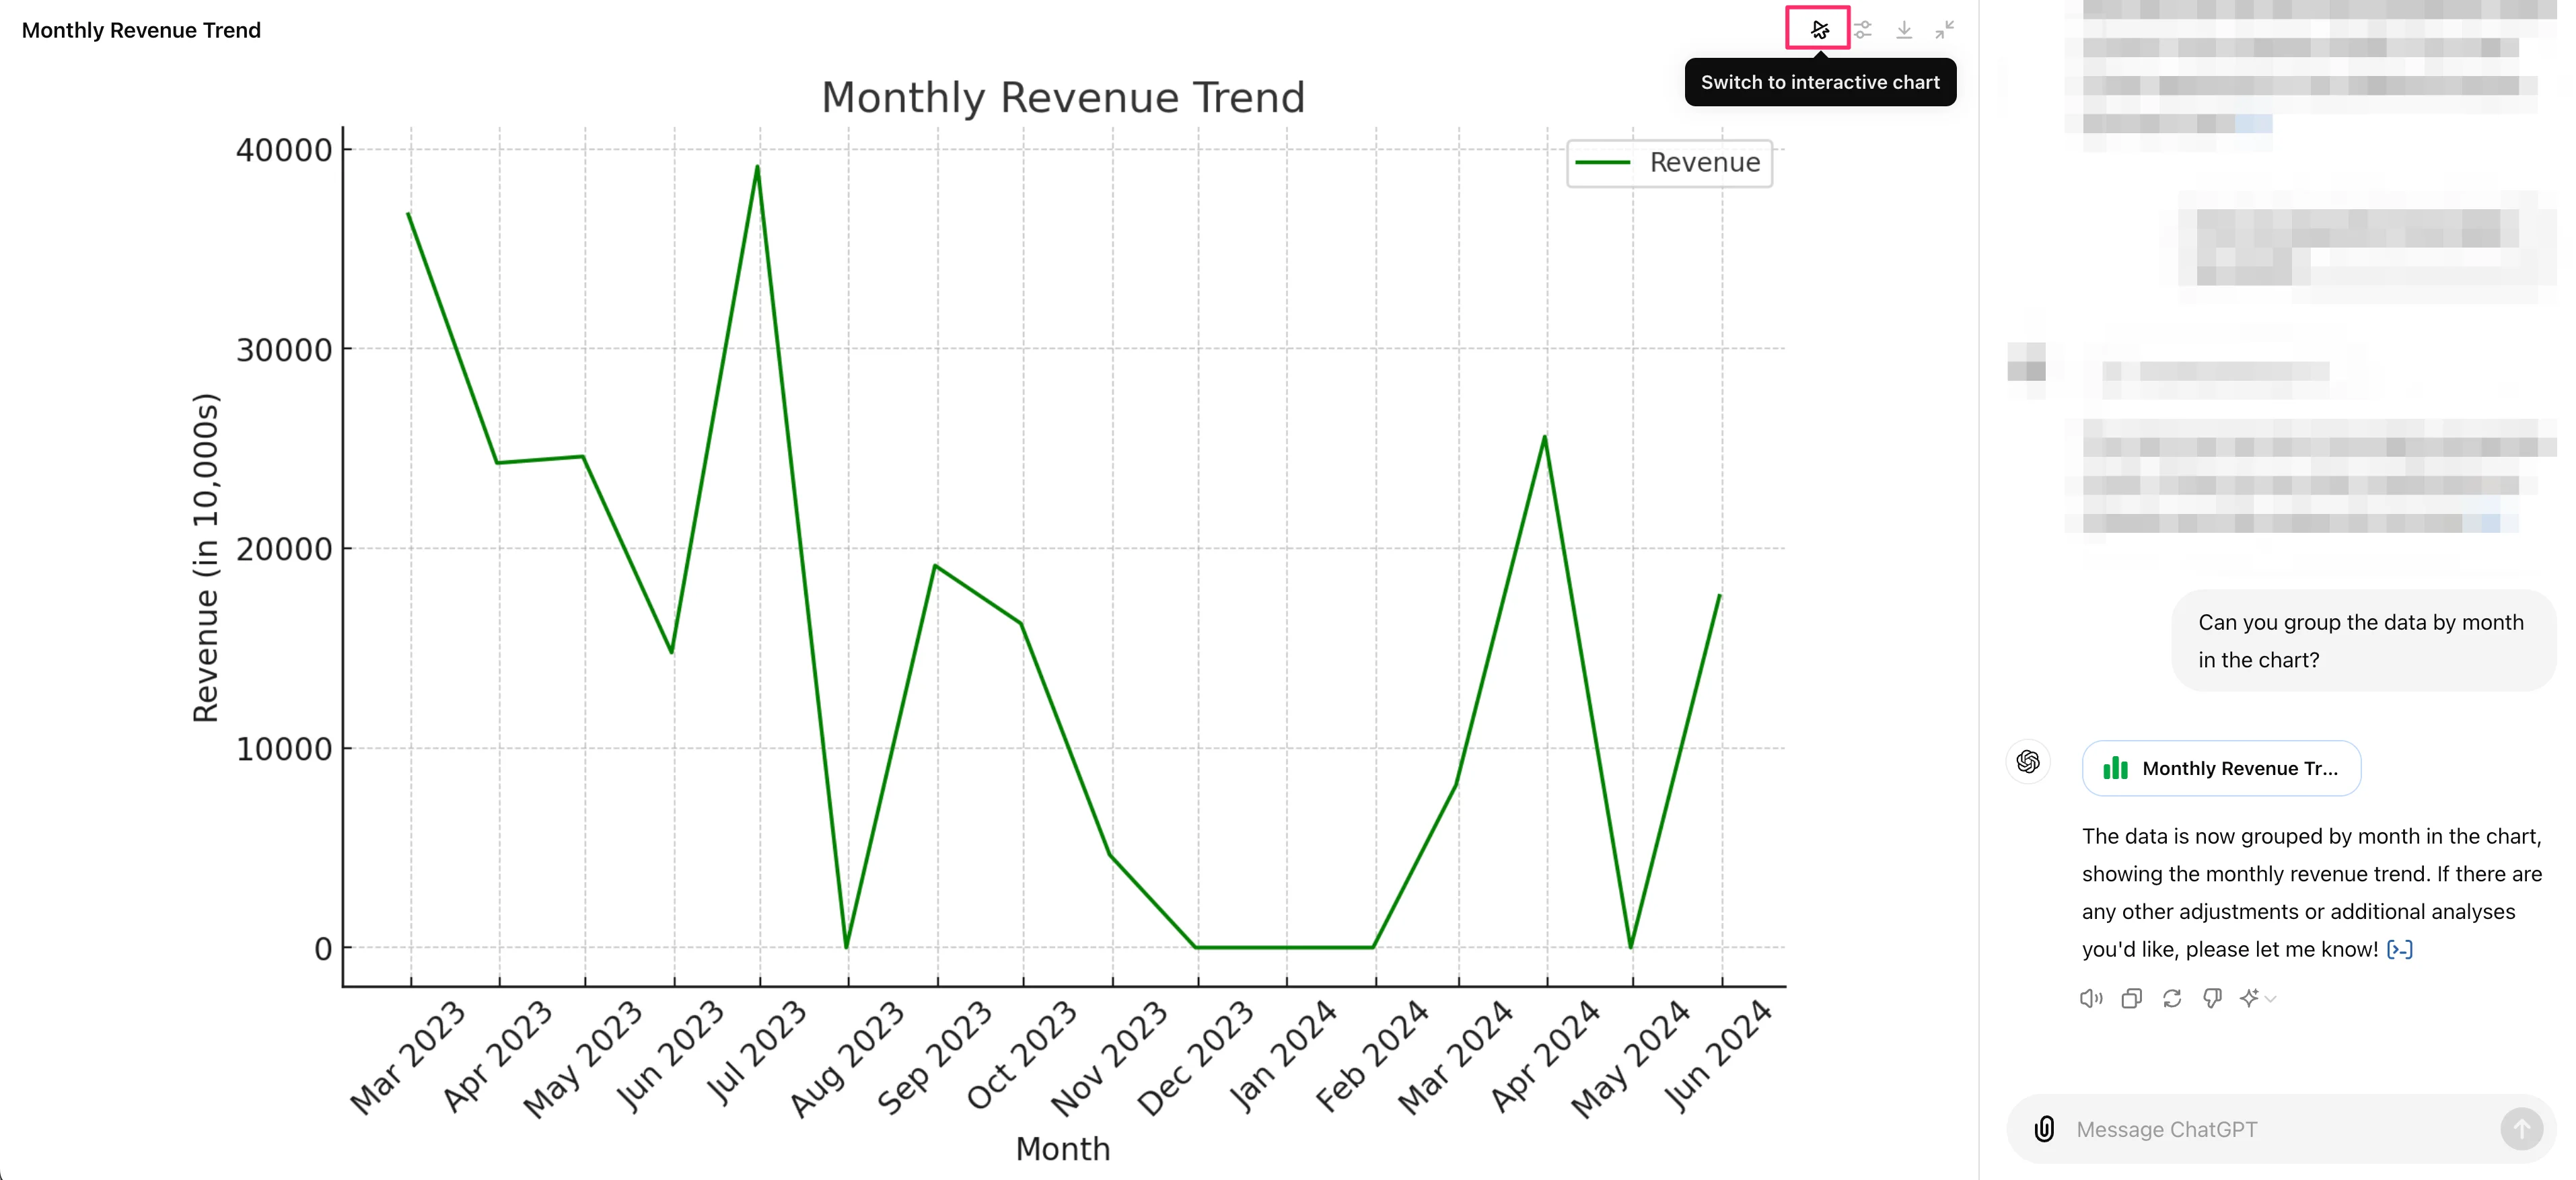
We can also update the graph axes by telling ChatGPT to group the data differently. In this example, we’ll ask ChatGPT to group the data by month.
Sample prompt:
Can you group the data by [insert variable] in the chart?
Customize and download charts for presentations and documents
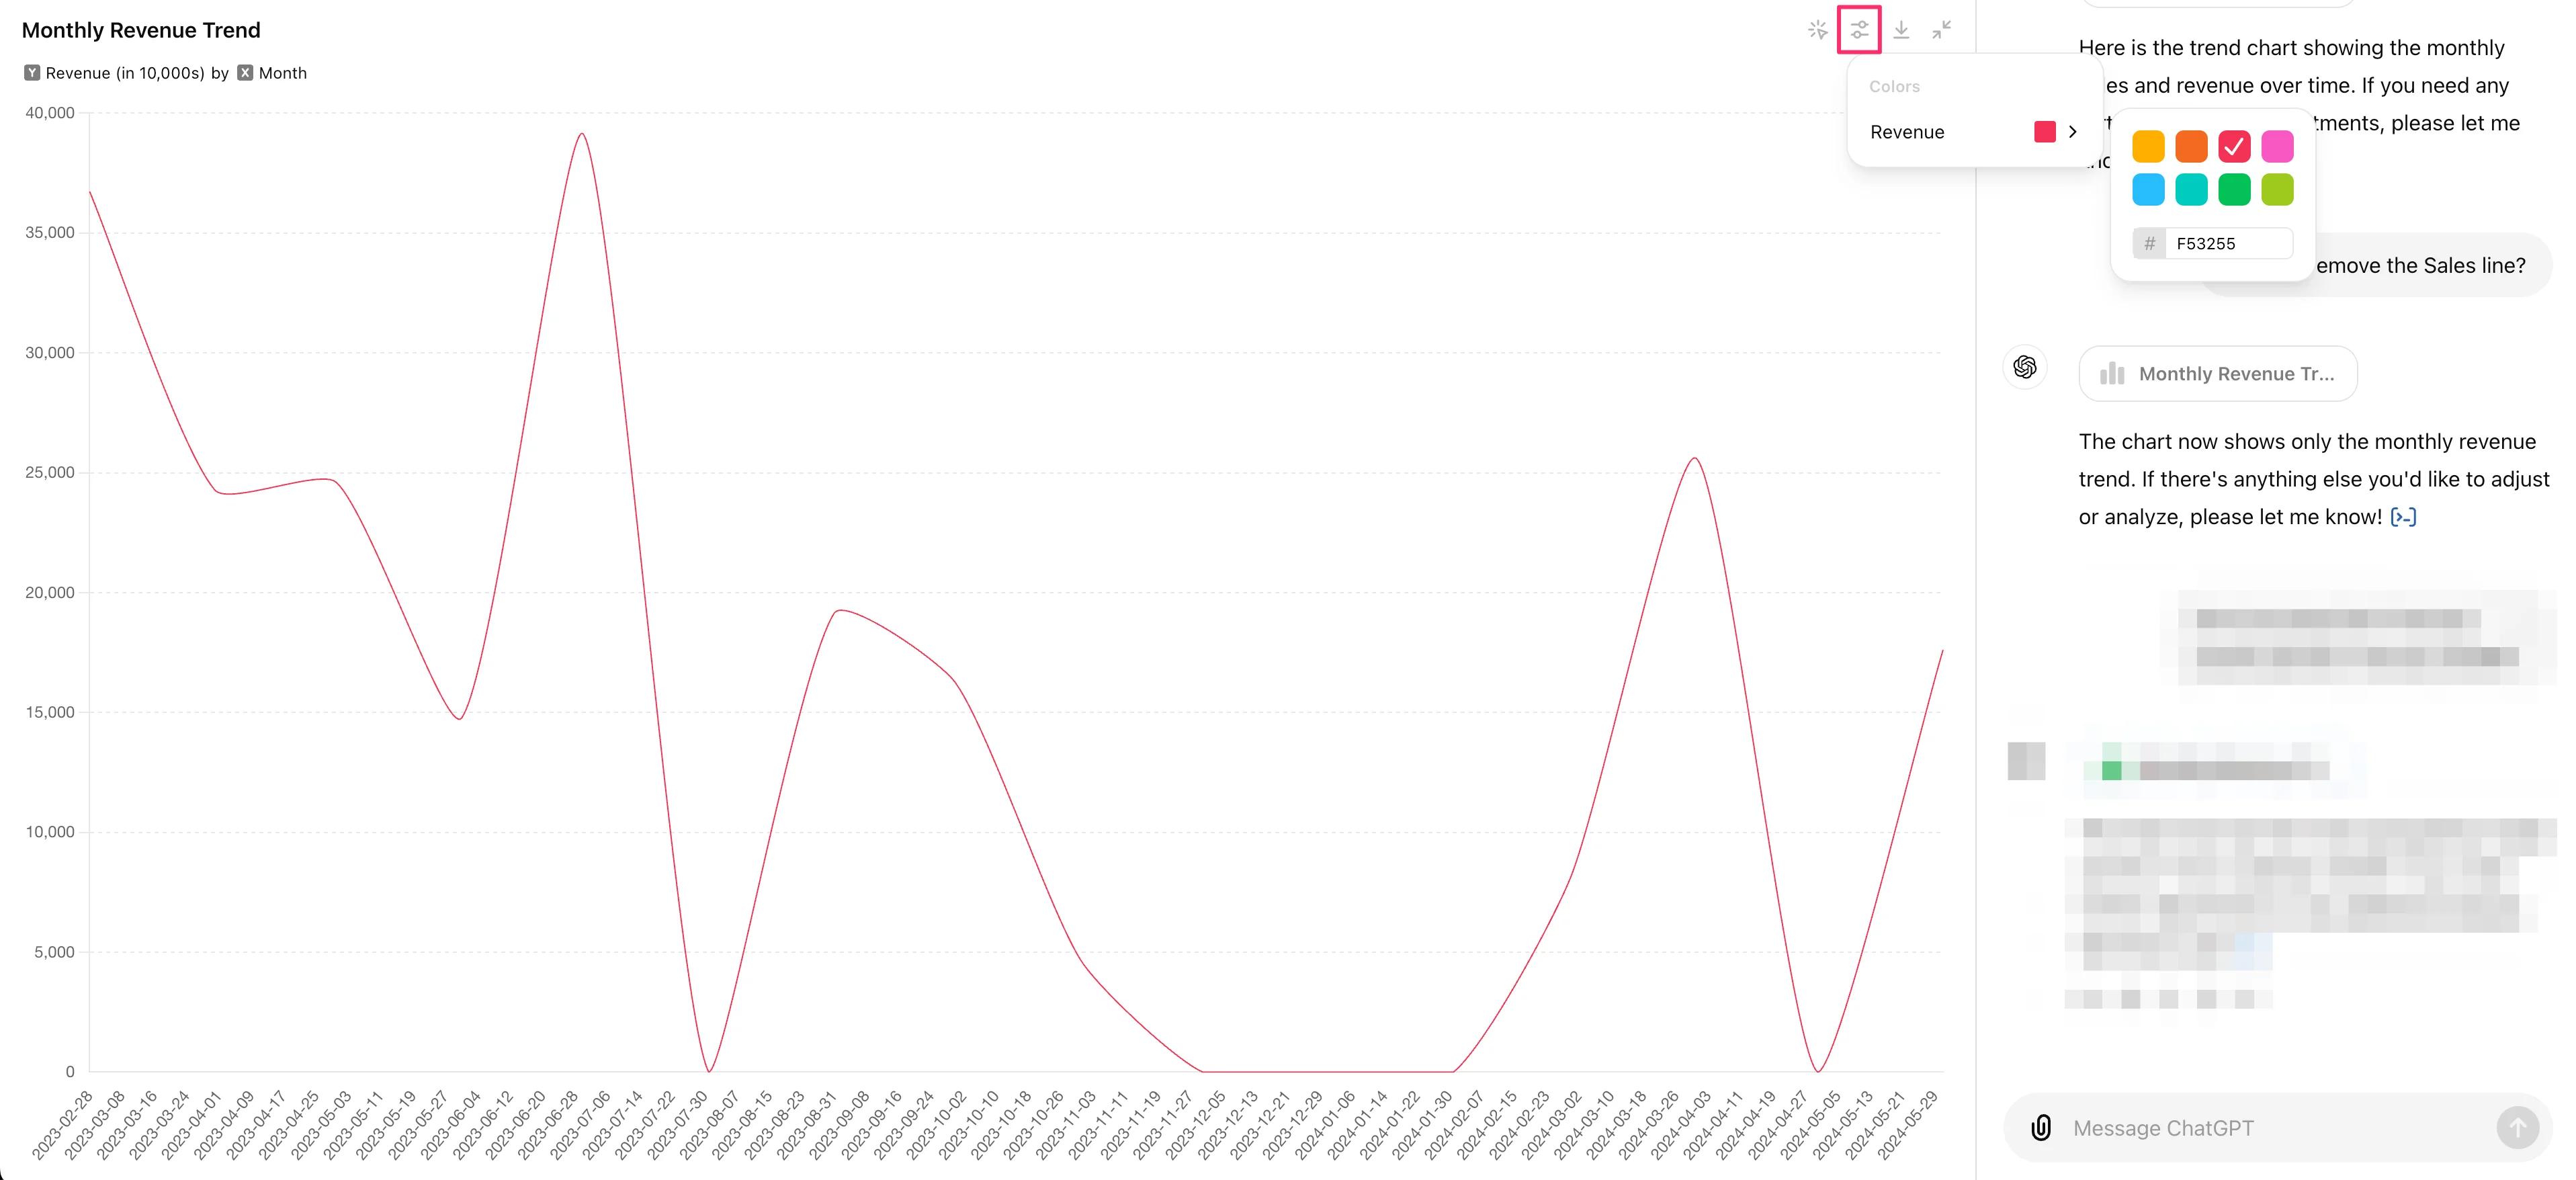
Now that we have our data structured in the way we like, we can update the colors on the chart. To do this, click on the Settings button in the top right corner, hover over the colored item you want to update (in this case our Revenue line), and select a new color either from the provided swatches or via hex code. We’ll change our trend line to red in this example.
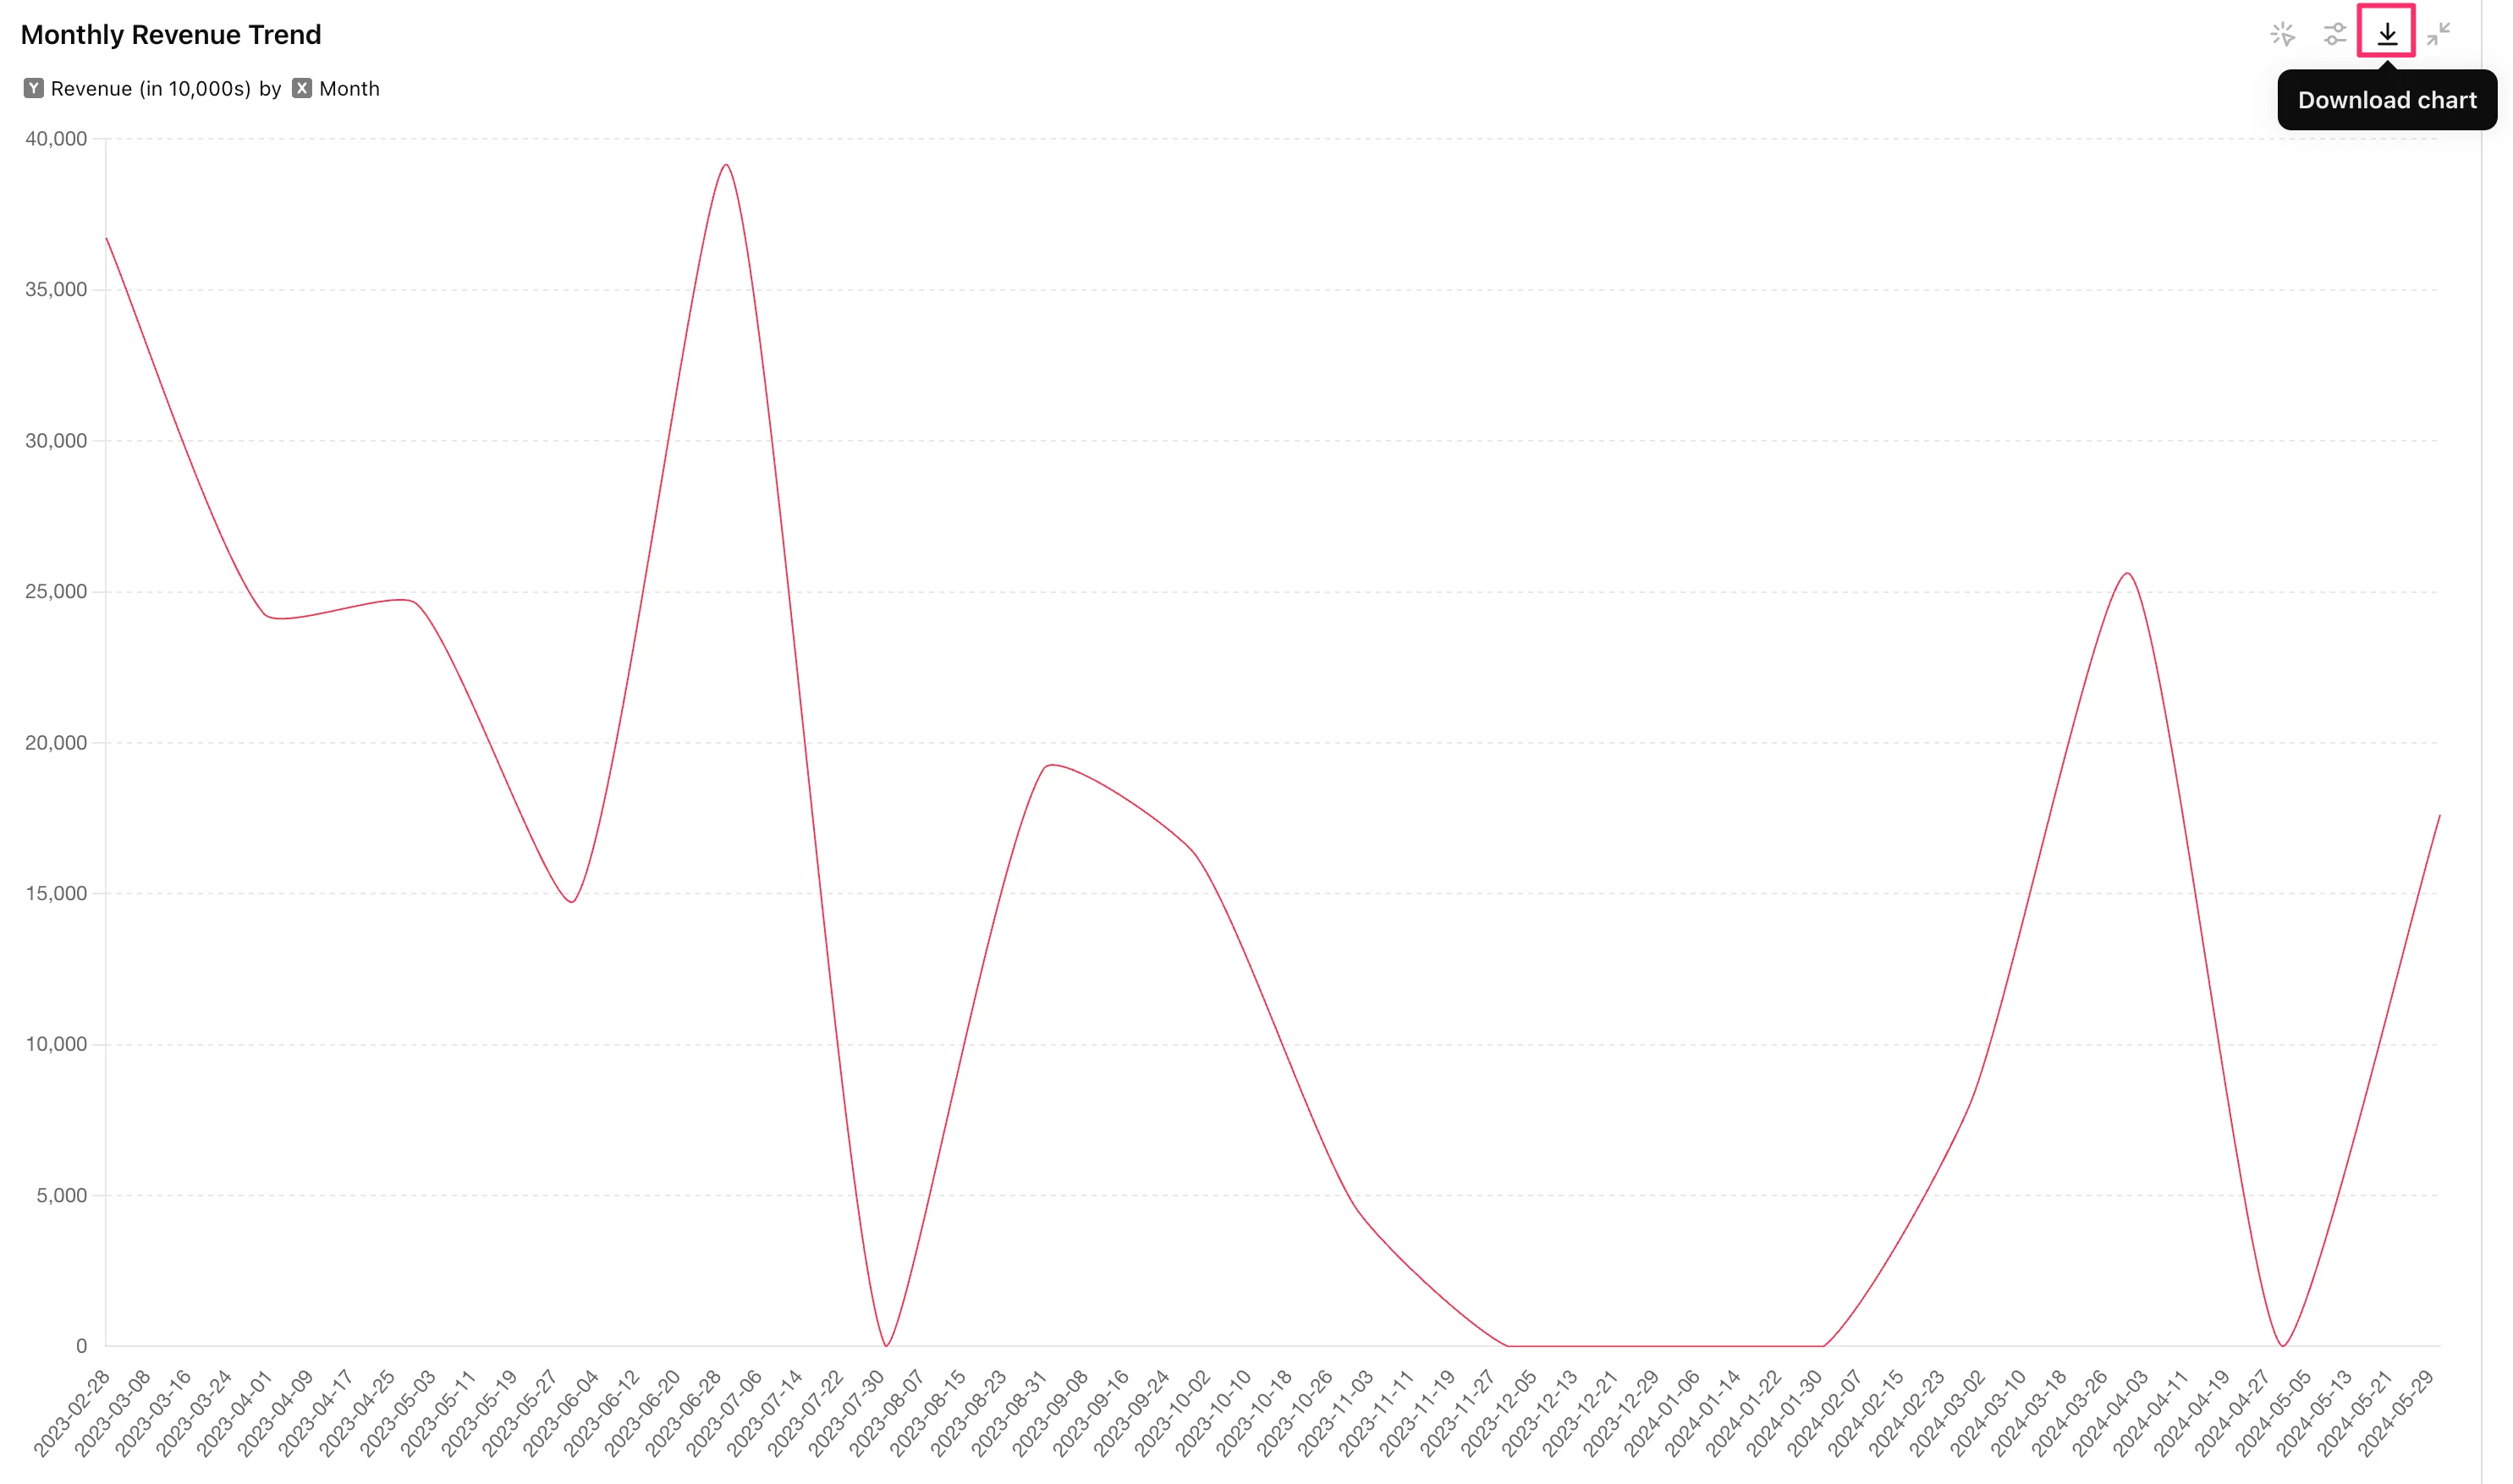
Once you’re happy with the appearance, you can download the chart with the download button in the top right corner.
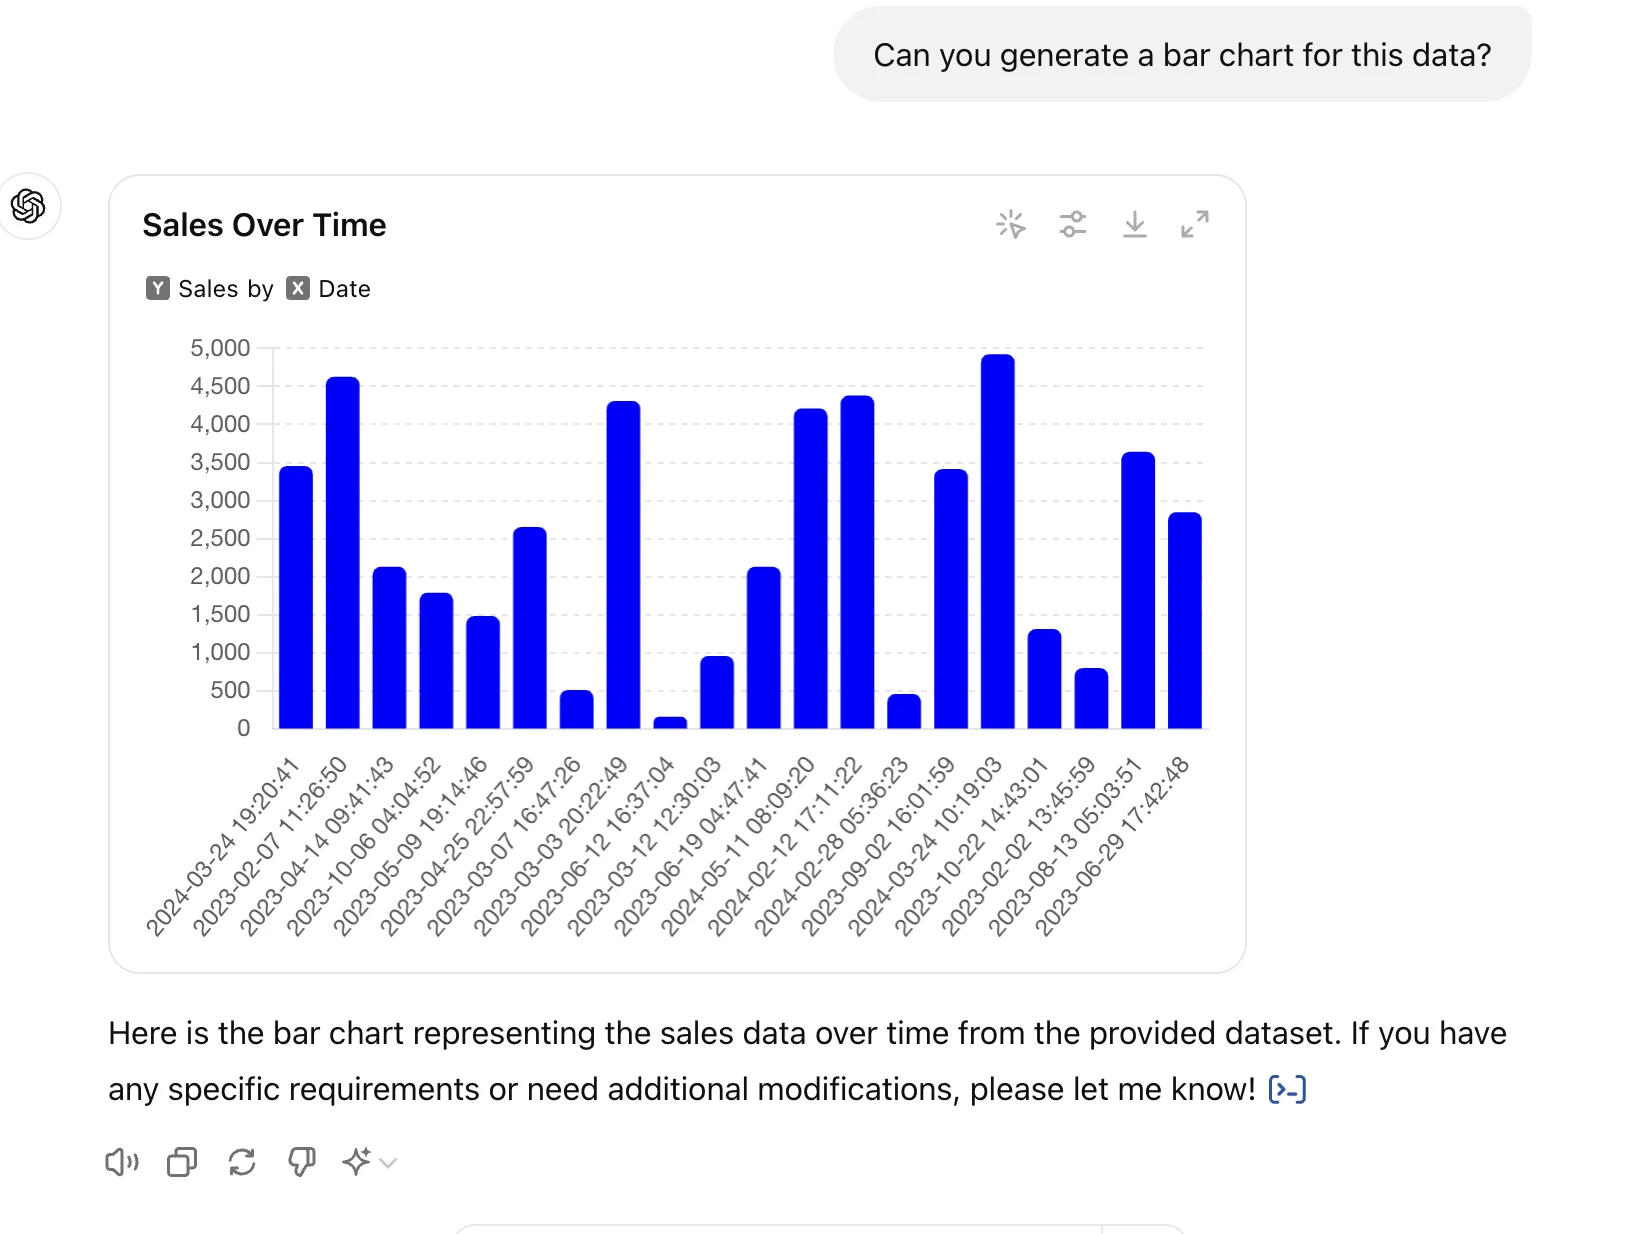
Lastly, you can experiment with other chart and graph visuals. To do this, collapse the expanded view and ask ChatGPT to generate new visuals by the specific graph type. To start, we’ll generate a bar chart.
Can you generate a [insert chart type] for this data?
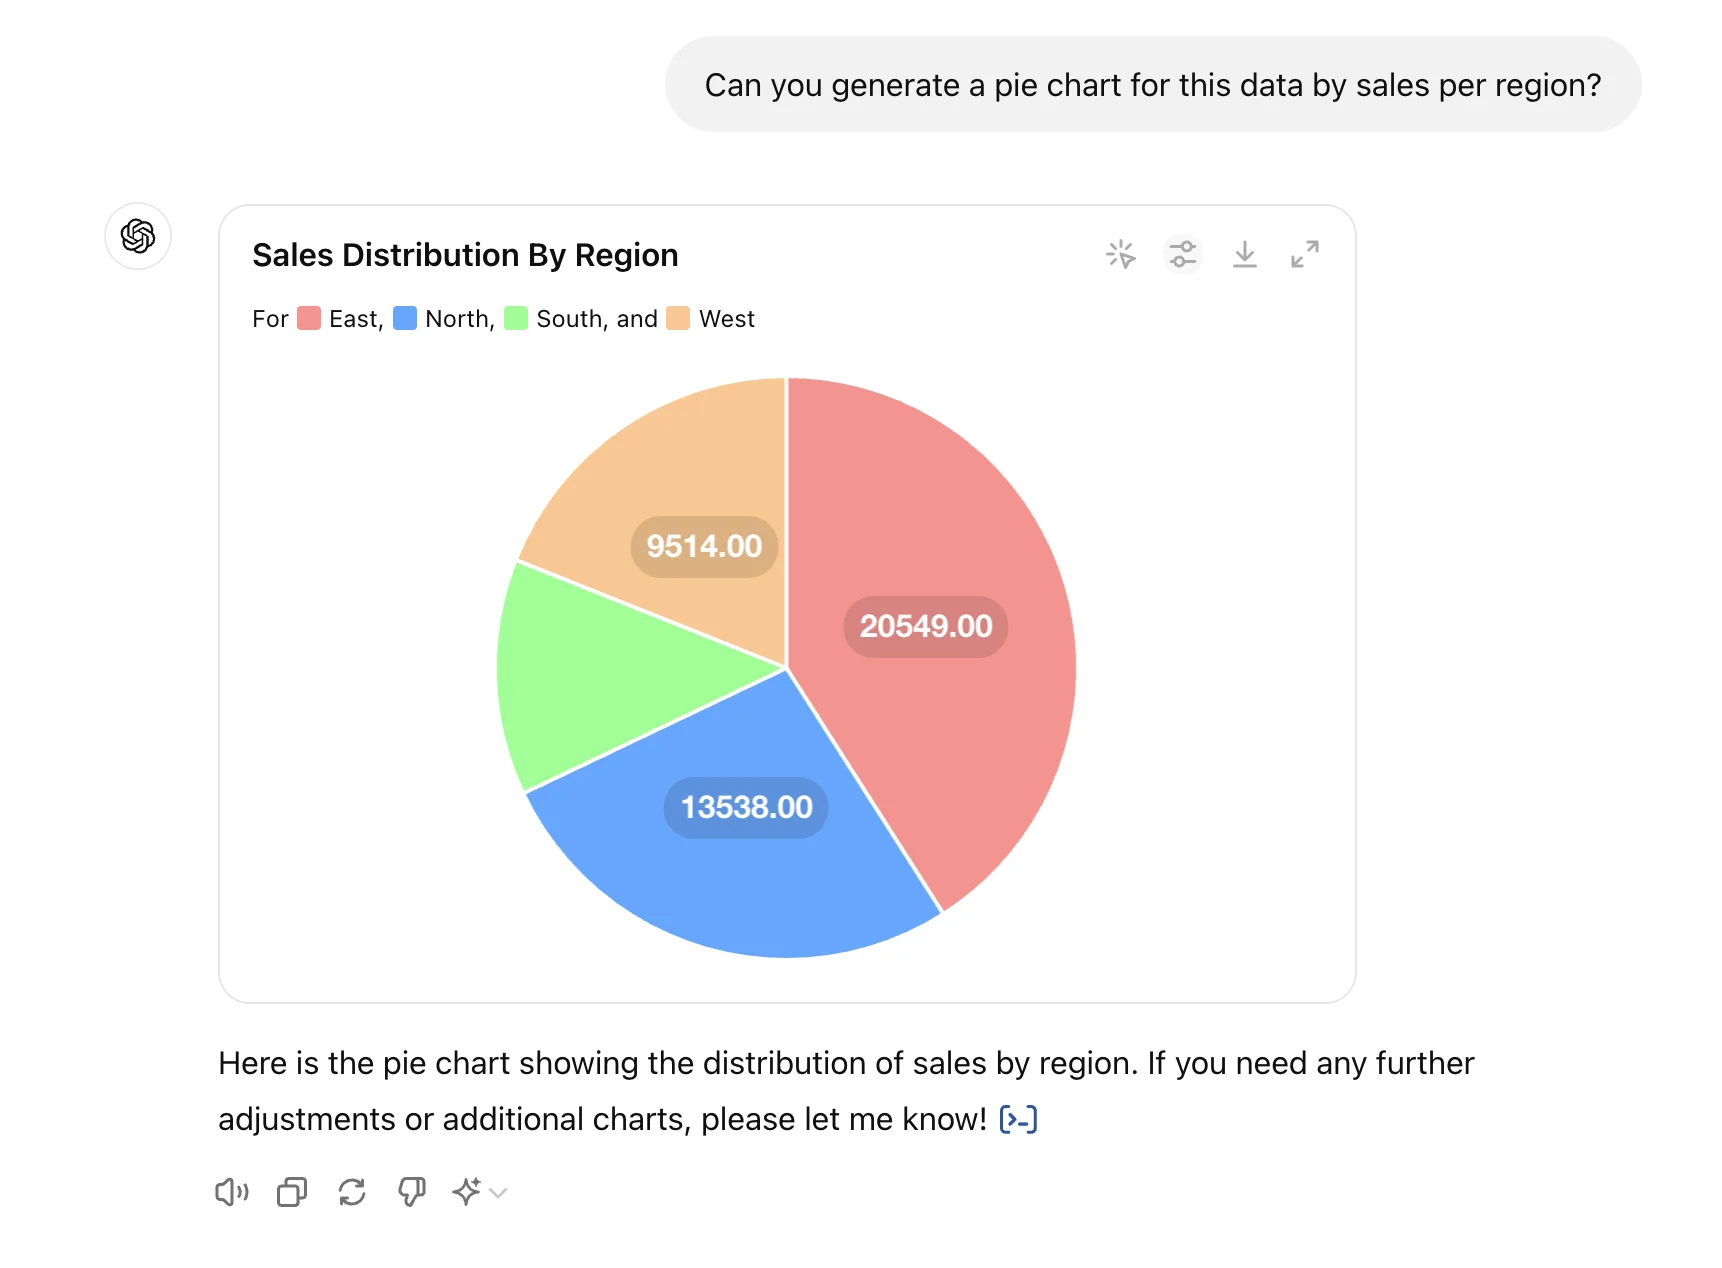
Finally, you can request ChatGPT to generate a chart by specific groupings by adding them to your prompt. In this example, we’ll generate a pie chart by sales per region.
Can you generate a [insert chart type] for this data by [insert variable] per [insert variable]?
And that’s it! If you’ve made it this far, you’re a ChatGPT data visualization pro. We find it’s a great tool for experimenting with data visualizations to eventually drop into presentations or use as a pre-production step in your data analytics process.
This tutorial was created by Garrett.